
Predicting Seismic Activity
When the 2011 Tohoku earthquake struck Japan, the sheer force of the shifting crust caused unexpected damage to coastal infrastructure. This event serves as a grim reminder that our ability to foresee crustal movement remains limited by current technology. We must move beyond simple observation to understand the mechanical stress building deep beneath our feet. Predicting these events requires a synthesis of data that links surface tremors to deep subterranean shifts.
Monitoring Crustal Stress and Deformation
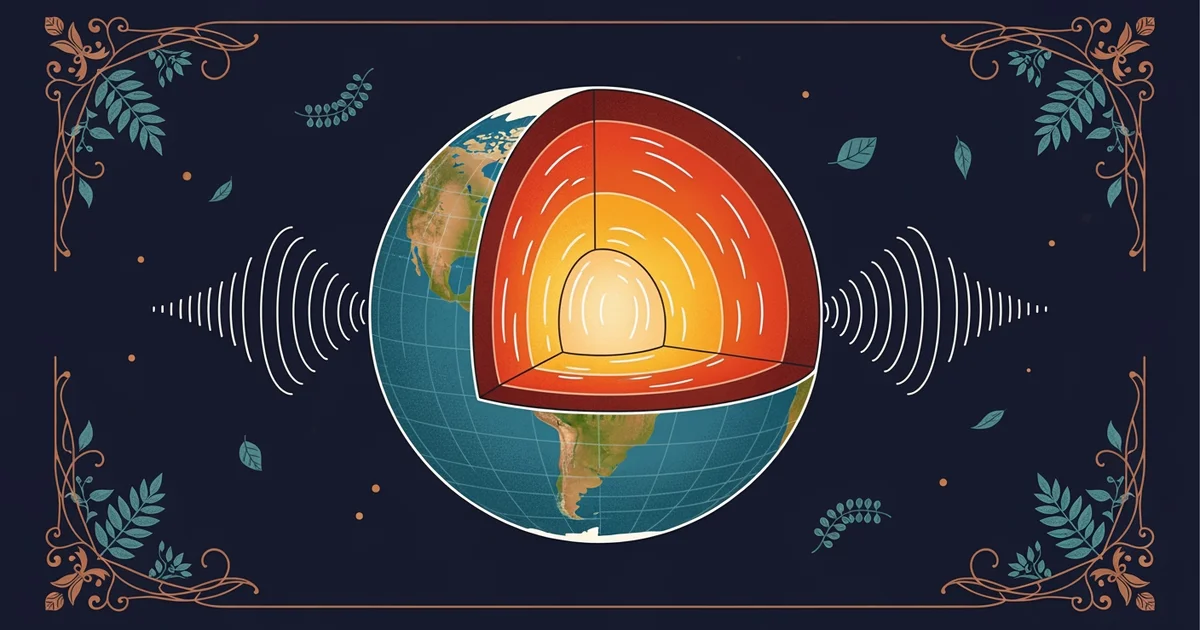
Scientists track the movement of tectonic plates by measuring tiny shifts in the Earth's surface using global positioning systems. These measurements reveal how much energy accumulates along fault lines before a rupture occurs. Think of this process like stretching a giant rubber band until it reaches its breaking point. If you pull the rubber band slowly, you can predict exactly when the tension will cause it to snap. However, the Earth is far more complex than a simple rubber band because the material properties of the crust change constantly. We use seismic tomography to map these underground variations by analyzing how earthquake waves travel through different rock densities. By identifying zones where rocks are brittle or soft, researchers can estimate where stress will likely focus during the next major event.
Key term: Seismic tomography — a technique that uses seismic wave data to create three-dimensional images of the Earth's internal structure.
Predictive Analytics and Risk Assessment
Advanced computer models now integrate this structural data to simulate potential earthquake scenarios across high-risk regions. These models account for the specific geometry of faults and the historical frequency of past seismic activity. By running thousands of simulations, experts can determine the probability of a large event occurring within a specific time window. This is similar to how an insurance company calculates the risk of a house fire based on local climate and building materials. While the company cannot prevent the fire, they can predict the likelihood and help homeowners prepare for the worst. We apply the same logic to seismic zones to improve building codes and emergency response plans. The following table highlights the primary data points used to create these regional risk profiles.
| Data Type | Measurement Source | Purpose of Analysis |
|---|---|---|
| Strain Rate | Satellite GPS | Tracking plate velocity |
| Wave Speed | Seismic Sensors | Mapping crust density |
| Fault Slip | Geological Survey | Estimating past events |
We must constantly refine these models as new data arrives from deep sensing arrays. The integration of these inputs allows for a more nuanced understanding of how seismic energy propagates through the lithosphere. When we combine surface movement data with internal density maps, we gain a clearer picture of the hidden forces at play. This application of data science represents a major leap forward from the reactive methods used in previous decades. We are now moving toward a framework where predictive accuracy improves with every recorded tremor. This progress is essential for protecting communities located near active plate boundaries.
Our current strategy relies on three distinct layers of monitoring to ensure we do not miss subtle warning signs:
- The first layer involves continuous satellite observation which tracks millimeter-scale changes in land elevation across thousands of square miles.
- The second layer utilizes dense networks of ground-based seismometers that record the frequency and intensity of smaller, non-destructive tremors.
- The third layer incorporates deep-crustal modeling which simulates how heat and pressure influence the long-term stability of major fault zones.
By layering these data sources, we can distinguish between normal background noise and the genuine precursors to a major seismic event. This multi-layered approach ensures that our models remain grounded in physical reality rather than relying solely on abstract mathematical projections.
Predicting seismic activity relies on combining real-time surface deformation measurements with high-resolution models of the hidden geological structures beneath our feet.
But this model breaks down when unexpected fluid injection or human-induced activity changes the stress balance on a fault line.