
Mortality and Survival
Imagine you are running a business where you must track how many customers stay loyal over time. Some businesses lose most clients immediately, while others keep them for years before a sudden drop occurs. This simple business logic mirrors how scientists track the life cycles of different species in the wild. By observing these patterns, we can predict the future of a population based on their current age structure. This mathematical approach helps us understand the survival strategies that different animals use to thrive within their specific environments.
Understanding Survivorship Curves
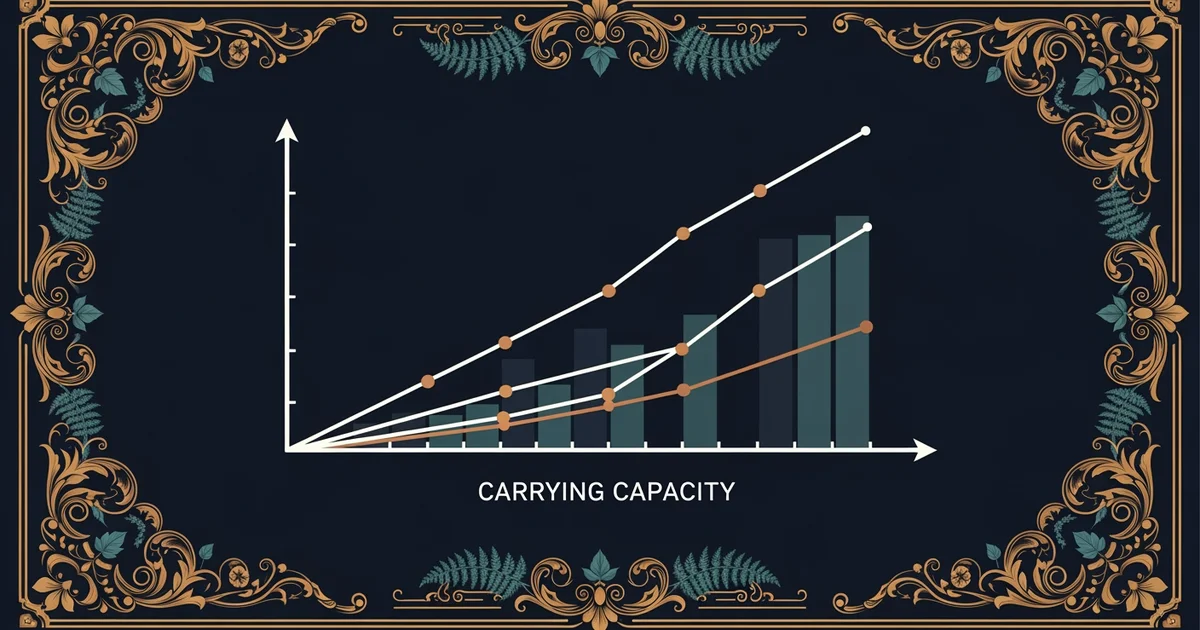
When researchers plot these survival patterns on a graph, they create what we call survivorship curves. These curves show the probability of an individual surviving to a specific age within a group. The vertical axis typically represents the number of survivors on a logarithmic scale, while the horizontal axis tracks the percentage of the maximum lifespan. By looking at these shapes, we can identify how much energy a species invests in its offspring versus its own survival. This visual data provides a clear picture of how mortality rates shift as the population ages.
Key term: Survivorship curve — a graphical representation of the number of individuals surviving to each age for a given species.
These curves are generally categorized into three distinct types based on their shape and mortality trends. Type I curves show that most individuals live to an old age, with death rates increasing only as they reach the end of their lifespan. Humans and large mammals often follow this pattern because they provide extensive care for their young. Type II curves show a constant mortality rate regardless of age, meaning an individual is just as likely to die at any stage of life. Type III curves reflect species that produce many offspring but see most of them die shortly after birth.
Comparing Survival Strategies
To better understand these differences, think about the way a high-end luxury brand operates compared to a mass-market discount store. A luxury brand invests heavily in a few high-quality products to ensure they last for a long time, much like a Type I species. In contrast, a discount store relies on moving massive volumes of low-cost items, knowing that many will be discarded quickly, which mimics a Type III strategy. This economic analogy helps explain why certain species produce thousands of eggs while others raise only one or two offspring at a time.
| Curve Type | Mortality Pattern | Example Strategy | Investment Level |
|---|---|---|---|
| Type I | Low until late age | High parental care | Heavy investment |
| Type II | Constant throughout | Moderate survival | Steady effort |
| Type III | High early in life | Many offspring | Low per offspring |
We can see how these patterns dictate the logic of population growth across various ecosystems. When a species follows a Type III curve, the population depends on the sheer quantity of births to offset the high infant mortality rate. If the environment changes, these species might recover quickly because they produce so many new members. Conversely, Type I species are more vulnerable to environmental shifts because they cannot replace their numbers as fast as they lose them. Tracking these trends allows ecologists to calculate the risks of extinction for different groups.
Understanding these survival trends is essential for managing natural resources and protecting vulnerable groups in our changing world. By applying these mathematical models, we gain insight into the delicate balance between birth and death rates. This knowledge allows us to predict how different groups might respond to threats like habitat loss or climate change. We can then develop better strategies to ensure that these populations remain stable and healthy for future generations. Mathematical patterns serve as our primary tool for navigating the complex reality of biological survival.
Survivorship curves provide a mathematical framework that explains how species balance their survival strategies through varying levels of parental investment and mortality rates.
The next Station introduces migration and dispersal, which determines how individuals move between populations to change these survival dynamics.