
Exponential Growth Models
Imagine you have a single penny that doubles in value every single day for one month. By the end of that month, you would possess over five million dollars from that small start. This rapid increase illustrates the power of numbers growing at an accelerating rate over time. When we look at nature, many populations follow this exact pattern of swift expansion under perfect conditions.
The Mechanics of Rapid Expansion
When a population has access to unlimited resources, it enters a phase of exponential growth. This mathematical pattern describes a situation where the number of individuals increases by a fixed percentage over regular intervals. Because every new individual can eventually reproduce, the total number of offspring grows larger with each passing generation. Think of this like a snowball rolling down a mountain slope covered in deep, fresh powder. As it rolls, it picks up more snow, which increases its surface area, allowing it to collect even more snow in the next rotation. This process creates a self-reinforcing cycle that causes the size of the snowball to explode in volume very quickly.
In mathematical terms, we represent this growth using a specific formula that accounts for the starting population and the rate of increase. The equation allows scientists to predict the size of a group at any future time. In this formula, the variable represents the initial population size, while is the growth rate and represents the time elapsed. The constant is a special number in mathematics that appears whenever systems grow continuously. By using this model, researchers can estimate how fast a new species might spread through a fresh habitat when no predators are present.
Visualizing the Growth Curve
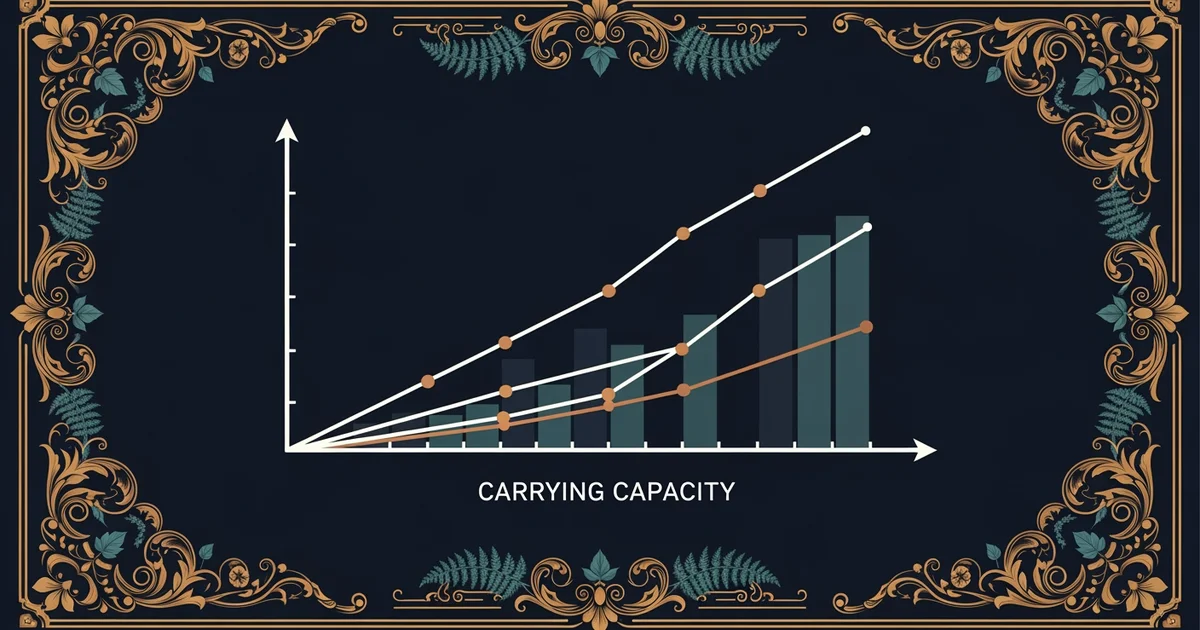
If you plot this data on a graph, the line does not move upward at a steady, predictable angle. Instead, it starts out moving slowly along the bottom of the axis before curving sharply toward the top. This shape, known as an exponential curve, represents the transition from slow beginnings to massive surges in population density.
Key term: Exponential curve — a graphical representation showing how a value increases at a rate proportional to its current size.
To understand how different variables impact this curve, consider these three factors that determine the steepness of the line:
- The initial population density determines the starting point on the vertical axis — a larger starting group will reach high numbers much faster than a small group.
- The intrinsic growth rate dictates how sharply the curve bends upward — a higher birth rate creates a much steeper slope as the population doubles more frequently.
- The time interval chosen for observation changes how dramatic the growth appears — short intervals show small steps, while long intervals reveal the massive scale of total expansion.
| Variable | Symbol | Impact on Growth |
|---|---|---|
| Initial Count | Sets the starting height | |
| Growth Rate | Controls the curve steepness | |
| Time Elapsed | Determines the final population |
When we study these models, we assume that nothing slows the process down. In the real world, this phase of rapid expansion is often short because space and food eventually run out. While the math shows us what is possible under ideal conditions, the next phase of our study will look at the factors that force these curves to level off and stabilize. Understanding the ideal growth model is the first step in seeing how nature reacts when limits are finally removed from an environment.
Mathematical models of exponential growth demonstrate how populations explode in size when resources remain abundant and constraints are absent.
The next Station introduces logistic growth patterns, which determine how environmental resistance changes the shape of these curves.