
Natural Hazard Modeling
When the 1906 San Francisco earthquake ruptured the earth, the city crumbled because the ground could no longer hold the stored energy. This event illustrates the extreme danger of stress accumulation along fault lines, which is a core concept that geophysicists study to protect human lives today. Understanding how rocks store energy like a stretched rubber band allows scientists to estimate when a region might reach its breaking point. By applying physics to geology, we can transform raw data into actionable risk maps that guide urban planning and infrastructure safety.
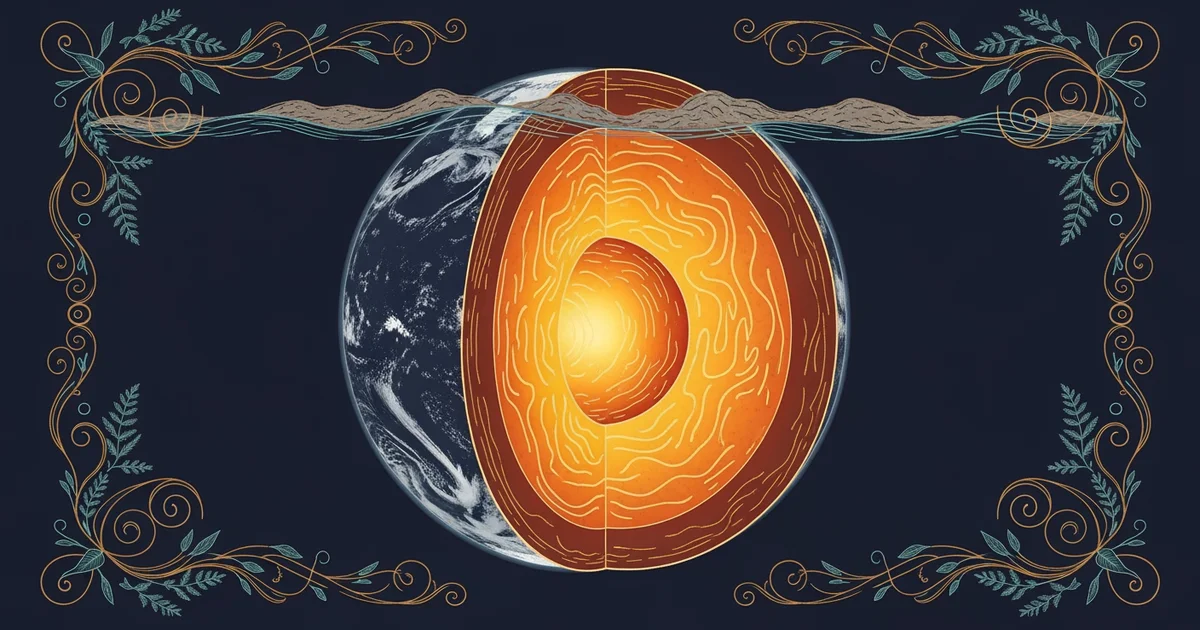
Understanding Energy Storage
Rocks beneath our feet behave much like solid springs that store potential energy as plates slowly drift apart. As tectonic forces push against these immovable rock masses, the friction prevents them from sliding smoothly past one another. This resistance causes the crust to deform, storing immense amounts of energy deep underground over long periods of time. This is similar to a credit card debt that grows slowly until it suddenly becomes impossible to pay back. The crustal deformation continues until the internal stress exceeds the frictional strength of the fault plane.
Key term: Stress accumulation — the process where tectonic plates lock together and build up potential energy until the rock eventually fractures.
Once the accumulated stress surpasses the threshold of the rock's structural integrity, a sudden slip occurs to release the pressure. This release manifests as seismic waves that travel through the planet, causing the shaking we experience at the surface. To model this, scientists use the following mathematical relationship to track the force density:
Here, represents the shear stress, is the shear modulus of the rock, is the displacement, and is the thickness of the layer. By calculating these variables, researchers can identify areas where the crust is nearing a critical state of failure.
Assessing Regional Hazard Levels
Predicting the timing of a major event remains difficult, but assessing the probability of occurrence is a standard practice in modern geophysics. Experts evaluate regional risk by looking at historical slip rates and the current state of deformation measured by global positioning systems. The following table outlines how geologists categorize fault zones based on their observed activity and potential for future movement:
| Fault Status | Activity Level | Risk Assessment | Predicted Action |
|---|---|---|---|
| Locked | High | Severe potential | Reinforce structures |
| Creeping | Low | Constant release | Monitor movement |
| Dormant | Unknown | Baseline risk | Geological mapping |
These categories help engineers determine where to implement stricter building codes to minimize damage during future events. Every region requires a unique model because the composition of the crust varies significantly from one location to another. If a region has a high slip rate, the frequency of smaller, less damaging events might actually prevent a massive catastrophe. Conversely, a locked fault that has not moved for centuries is statistically more likely to produce a high-magnitude rupture.
By comparing regional data, we can identify patterns that suggest where the next major earthquake might occur. This process involves analyzing the historical recurrence interval, which is the average time between large seismic events in a specific area. When we combine this with current stress measurements, we create a dynamic map of seismic vulnerability. This approach helps communities prioritize safety measures in areas where the geological tension is highest. It turns abstract physical forces into a clear plan for protecting citizens and their homes.
Predicting earthquake risk requires measuring how much energy the earth's crust stores before it eventually overcomes frictional resistance to snap into a new position.
But this model becomes complicated when we try to apply it to planetary bodies that lack active plate tectonics like our own.