
Seismic Imaging
When oil companies survey the Gulf of Mexico for new drilling sites, they send powerful sound waves into the ocean floor to map the hidden rock layers below. This process is just like using a high-tech medical ultrasound to see deep inside the Earth instead of the human body. By measuring how sound reflects off different stone densities, geologists create a detailed picture of the ground beneath our feet. This is seismic imaging, a core application of the wave physics concepts first introduced in Station 9.
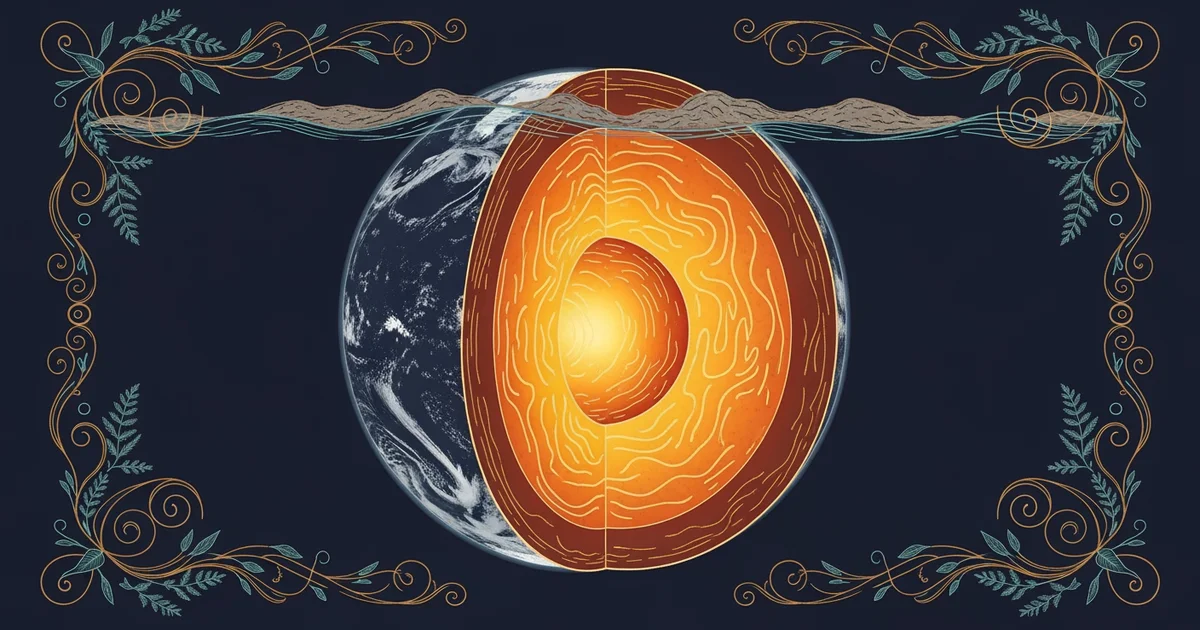
Interpreting Subsurface Structures
To understand what lies deep underground, scientists rely on the way sound waves travel through materials. When an acoustic pulse hits a boundary between two rock layers, a portion of that energy bounces back toward the surface. Sensors called geophones capture these returning echoes, recording the exact time and strength of each signal. Because waves move at different speeds through granite, shale, or liquid oil, the timing of these echoes reveals the shape of the layers. This is essentially the same as measuring how long it takes for your voice to echo off a distant canyon wall to judge the distance of the cliff.
Key term: Reflection — the process where sound waves strike a boundary between different layers and bounce back toward the surface.
Technicians process these raw signals to build a visual cross-section of the Earth. They adjust for the speed of sound in each rock type to ensure the depth measurements remain accurate. If the waves encounter a fault line or a pocket of gas, the signal changes in a predictable way. By comparing these patterns to known geological samples, experts can identify where valuable resources might hide. The following table outlines how different materials affect wave behavior during the imaging process:
| Material Type | Wave Speed | Reflection Strength | Potential Finding |
|---|---|---|---|
| Loose Sediment | Slow | Low | Surface soil |
| Solid Granite | Fast | High | Bedrock |
| Porous Sand | Moderate | Variable | Oil or water |
Mapping the Earth Layers
Once the data is collected, analysts transform the digital signals into a map that looks like a slice of a layer cake. This map allows geologists to identify structures like folds or domes that often trap oil and natural gas. Creating this map requires careful attention to the density of the rock, as denser materials reflect more energy than softer ones. If the data shows a clear, bright line on the screen, it indicates a sharp change in rock type. These visual patterns help engineers decide where to place a drill without wasting time or money on empty sites.
Mapping the subsurface is a multi-step process that requires precision at every stage of the operation:
- Energy sources send controlled vibrations into the ground to create waves that penetrate the deep crust.
- Arrays of sensors detect the returning vibrations and convert them into digital data for computer processing.
- Complex algorithms filter out noise from surface traffic or wind to isolate the deep geological signals.
- Visual profiles are rendered to show the geometry of underground layers for final analysis by experts.
This workflow ensures that the final image represents reality rather than simple background noise. By isolating specific frequencies, geologists can see through layers of salt or clay that might otherwise block the view. This clarity is essential for modern energy exploration, as it reduces the risk of drilling into unstable or unproductive ground. Effective imaging turns the dark, hidden interior of our planet into a clear, navigable landscape for human industry.
Seismic imaging uses the timing and strength of reflected sound waves to map the hidden physical structures located deep beneath the Earth surface.
But this model becomes difficult to interpret when complex geological folding distorts the path of the returning waves.