
Satellite Sensing Methods
When the Ozone Monitoring Instrument aboard the Aura spacecraft scans the globe, it tracks the invisible chemical pulse of our changing atmosphere. This orbital technology acts like a high-altitude detective, identifying specific gases by how they absorb sunlight as it passes through the air column. Just as a bank teller verifies a signature against a known record, these sensors compare incoming light data against the unique spectral fingerprints of various molecules. By mapping these readings, scientists can pinpoint pollution sources or track the recovery of the ozone layer across thousands of miles. This process builds on the chemical interactions discussed in Station 10, where we examined how acid deposition alters regional ecosystems through complex atmospheric reactions.
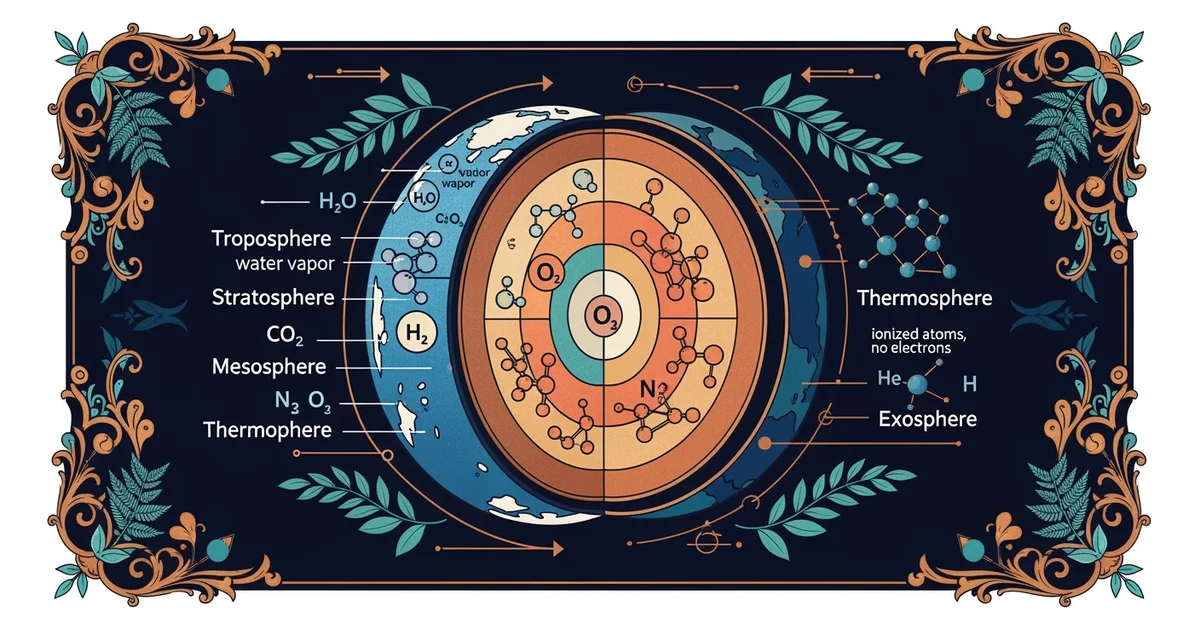
Detecting Molecular Signatures Through Spectral Analysis
Satellites identify chemical species by measuring the specific wavelengths of light that molecules absorb or scatter during their journey. Every gas molecule, such as or , possesses a distinct energy state that dictates which light frequencies it interacts with during transmission. When sunlight enters the atmosphere, these molecules act like selective filters, removing specific colors from the electromagnetic spectrum before they reach the satellite sensor. Researchers then interpret these missing pieces of the light spectrum to calculate the exact concentration of gases present in the vertical column of air. This method is similar to a merchant checking the authenticity of a currency bill by holding it up to a specific light frequency to reveal hidden watermarks.
Key term: Spectral fingerprinting — the process of identifying chemical substances by analyzing the unique patterns of light absorption or emission across the electromagnetic spectrum.
To ensure accurate data collection, sensors must account for atmospheric scattering caused by clouds and aerosols that interfere with light signals. Engineers design these instruments to operate within the ultraviolet, visible, and infrared ranges to capture the widest possible range of chemical signatures. The following table outlines how different sensors target specific atmospheric components based on their unique light absorption properties:
| Sensor Type | Target Chemical | Primary Wave Range | Detection Purpose |
|---|---|---|---|
| UV Spectrometer | Ozone | Ultraviolet | Layer thickness |
| IR Radiometer | Methane | Infrared | Heat trapping |
| Visible Imager | Nitrogen | Visible | Urban pollution |
Translating Orbital Data Into Environmental Insights
Once the satellite captures raw light data, ground-based computers convert the signals into visual maps that display global gas concentrations. This translation requires complex algorithms that adjust for the satellite's position, the sun's angle, and the time of day to ensure consistency. These maps provide a vital tool for policy makers who need to track whether international agreements on emission reductions are actually working in real time. By visualizing the movement of gases, we move beyond theoretical chemistry into the practical realm of planetary health management. The ability to monitor these invisible shifts allows us to see the direct impact of human activity on the chemistry of our shared atmosphere.
These automated systems rely on three primary components to maintain accuracy during their long-term observations of our planet:
- The optical telescope collects incoming photons from the atmosphere and focuses them onto a detector array for precise measurement.
- The grating component separates the collected light into individual wavelengths, allowing the system to isolate specific chemical absorption lines.
- The calibration source provides a stable reference signal to ensure that the sensor remains accurate despite the harsh conditions of space.
When we analyze these data sets, we are essentially reading the chemical history of the atmosphere as it happens. This constant surveillance provides the evidence needed to understand how localized chemical releases, like those causing acid rain, eventually influence global climate trends. By observing the atmosphere from above, we gain a perspective that ground-based monitors simply cannot match due to their limited geographic reach. This comprehensive view is essential for predicting future environmental shifts and developing strategies to protect the delicate balance of gases that sustain life on Earth.
Satellite sensing transforms raw light absorption data into actionable evidence by matching spectral signatures against known molecular patterns to map atmospheric health.
But this model faces significant challenges when thick cloud cover or extreme aerosol events obscure the transmission of light from the lower atmosphere.