GIS and Spatial Analysis
Imagine you are searching for a lost set of keys in a dark, messy room. You would likely start by checking the most probable spots, such as the sofa cushions or the kitchen counter, rather than searching every square inch of the floor randomly. Archaeologists face a similar challenge when they try to find hidden sites across vast, rugged landscapes that have remained untouched for thousands of years. They use Geographic Information Systems to narrow down these search areas by turning maps into powerful, data-driven tools. By layering different types of information, they transform a blank map into a detailed guide of human activity.
Visualizing Ancient Landscapes with Spatial Data
GIS software allows researchers to stack digital maps like transparent sheets on a light table to reveal hidden patterns. Each layer contains specific data, such as soil types, distance to fresh water, or the steepness of a mountain slope. By combining these layers, archaeologists can see how different environmental factors overlap to create ideal living conditions for ancient people. This process turns raw geographic data into a visual heatmap that highlights areas with high potential for finding artifacts. Think of this as a real estate agent filtering properties by price, location, and size to find the perfect home for a buyer. The software acts as the filter, helping the researcher focus their limited time and resources on the most promising locations.
Key term: Geographic Information Systems — a software framework that captures, stores, and analyzes spatial data to visualize relationships between environmental features and human activity.
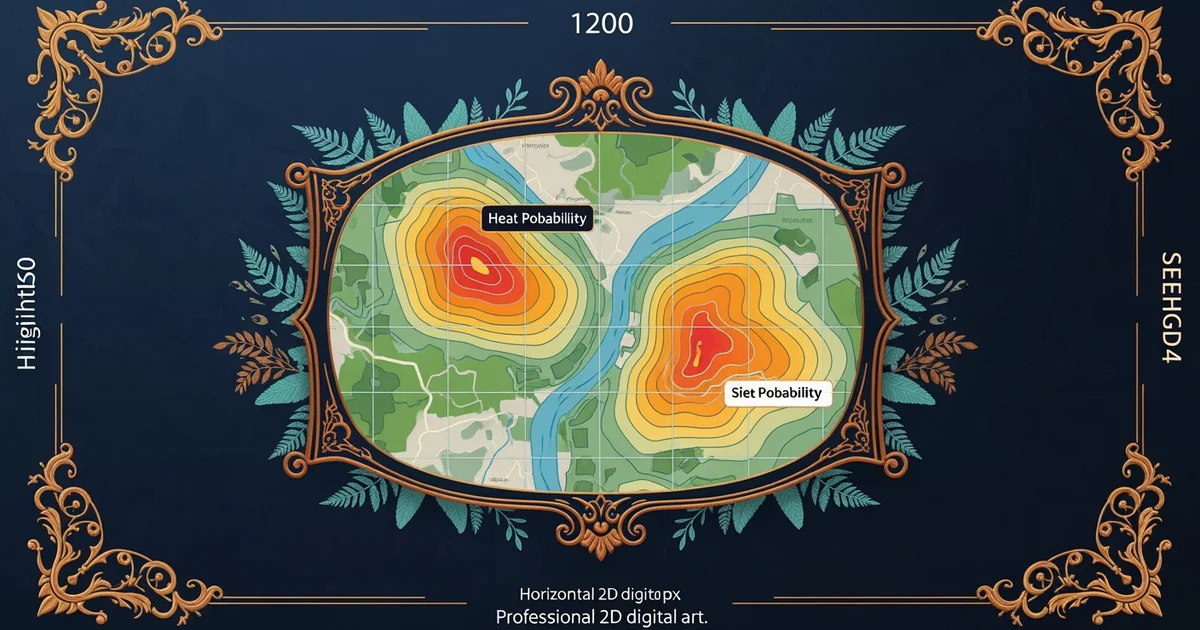
When we build these models, we must understand that ancient people preferred locations that offered both safety and easy access to resources. A site near a river provided water and transport, while a high ridge offered a clear view of the surrounding valley for defense. By assigning numerical values to these preferences, the software calculates a probability score for every piece of land in the study area. These scores are then displayed as colors on a map, where bright red indicates a very high likelihood of finding a site. This visual representation makes it much easier to plan field surveys and organize excavation teams effectively.
Analyzing Patterns Through Spatial Data Layers
To create an accurate model, we must carefully select the layers that truly influenced where people chose to settle long ago. Including irrelevant data, such as modern road construction, would only clutter the map and hide the actual archaeological patterns. The following layers are often used to build a robust predictive model for ancient settlement:
- Hydrology mapping: This layer identifies the proximity to rivers and springs, which were essential for daily survival and agriculture in almost all ancient societies.
- Slope analysis: This layer calculates the steepness of the terrain, as flat or gently rolling land was far more practical for building houses and farming.
- Aspect orientation: This layer measures the direction a slope faces, which determined how much sunlight a site received throughout the changing seasons of the year.
- Soil composition: This layer tracks the quality of the earth, as fertile soil was necessary for growing crops and supporting a stable, permanent population.
These factors work together to form a complex picture of the past that is impossible to see with the naked eye alone. By analyzing these layers, we can move beyond guessing and start using scientific evidence to guide our search for history. This digital approach ensures that we do not waste time digging in areas where people were unlikely to have lived. It also helps us protect sites that might otherwise be destroyed by modern development or natural erosion. Using technology in this way allows us to preserve the stories of the past for future generations to study and enjoy.
Predictive modeling uses layered geographic data to turn abstract environmental variables into a visual map that identifies where ancient people most likely established their settlements.
The next Station introduces Environmental Variable Selection, which determines how we choose the most meaningful data layers to ensure our predictive models remain accurate.