
Observing the Sun from Earth
Imagine you are watching a flickering lightbulb that dims and brightens in a predictable pattern. If you track these changes over years, you can predict exactly when the bulb will burn out. Observing our Sun from Earth feels much like watching that lightbulb to understand its hidden rhythm. We track dark spots on the surface to see how the Sun changes its energy output over time. These dark spots are cooler areas caused by intense magnetic activity within the star. By recording these spots, we build a history of solar behavior that helps us prepare for space weather events.
Tracking Solar Activity Patterns
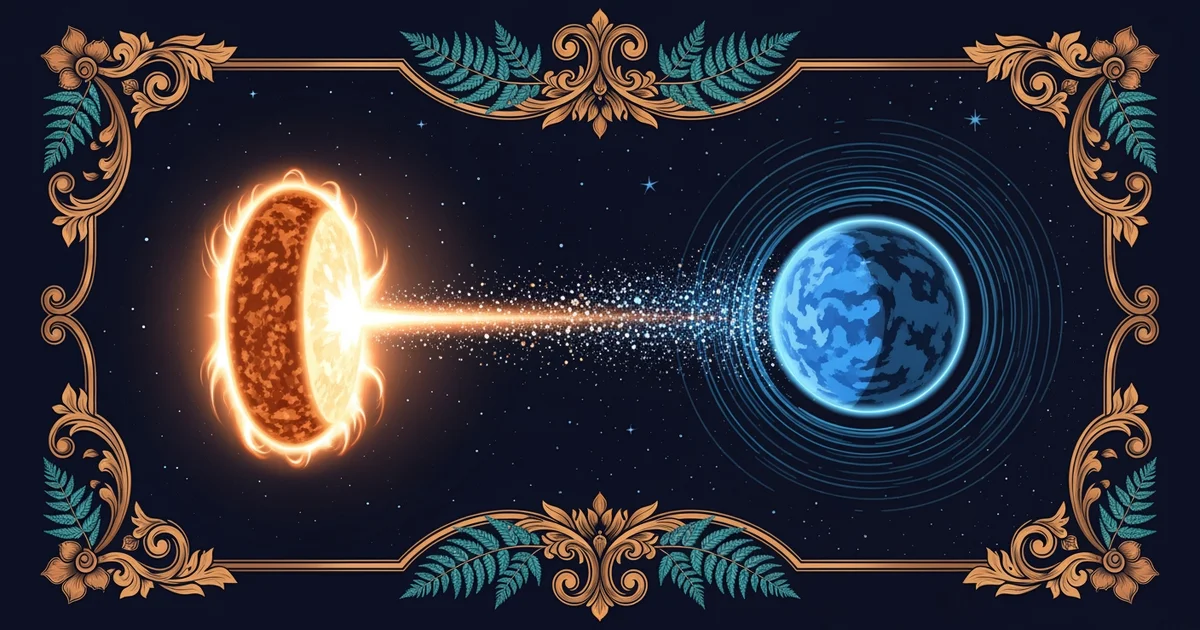
Scientists use historical records to understand how the Sun behaves over long periods of time. These records go back hundreds of years and show that the Sun follows a cycle of activity. During a peak in this cycle, the Sun produces more radiation and particles that can reach our planet. This process is like tracking a seasonal weather pattern where we know to expect more storms during certain months. We use this data to build models that predict how much impact the Sun will have on our modern technology. If we ignore these patterns, we risk losing power grids or satellite signals when the Sun becomes very active.
Key term: Sunspot — a temporary dark region on the solar surface that appears darker because it is cooler than surrounding areas.
Historical data acts as a guide for understanding the potential risks we face from space weather. By looking at how the Sun acted in the past, we can estimate how often major solar storms occur. This is similar to how an insurance company uses past accident records to set the price for your car insurance policy. They look at historical data to predict future risks and ensure they have enough money to cover potential damages. We do the same with solar data to ensure we protect our global infrastructure before a major solar event happens.
Using Historical Data for Modern Models
When we look at the history of these solar cycles, we notice that they are not always perfectly consistent. Some cycles are very intense while others are quite mild, which makes long-term predictions difficult for experts. We study these variations to improve our current models and make them more accurate for future planning. The following table highlights how different levels of solar activity affect our ability to observe and predict space weather events:
| Cycle Phase | Solar Feature | Impact on Earth | Frequency |
|---|---|---|---|
| Solar Minimum | Few sunspots | Low radiation | 11 years |
| Solar Maximum | Many sunspots | High radiation | 11 years |
| Grand Minimum | No sunspots | Very low heat | Centuries |
These patterns provide the foundation for our modern understanding of how the Sun influences the environment around Earth. By comparing current observations with these historical benchmarks, we can see if the Sun is acting within its normal range. This comparison is vital because it tells us if a sudden change is just part of a cycle or something more unusual. We constantly monitor these indicators to keep our technological systems safe from unexpected solar interference.
We also rely on ground-based observatories to capture high-resolution images of the solar surface every single day. These images allow us to track the movement and growth of sunspots in real time as they rotate across the face of the star. This information is then fed into computer models that simulate the magnetic fields connecting these spots to the outer atmosphere. Understanding these connections helps us predict when a solar flare might release energy toward our planet. Without this historical context, we would have no way to know if current activity is dangerous or simply routine.
Historical sunspot data allows us to create predictive models that shield our modern technology from the Sun's changing energy output.
Next, we will explore how the invisible magnetic fields of the Sun define the protective bubble known as the magnetosphere.