
Measuring Water Table Drops
Imagine you are checking your bank account balance only to realize that every single day, you withdraw more money than you deposit. Over time, your account balance will drop until you hit zero, leaving you with no funds to pay for your daily needs. This scenario describes the current state of many global aquifers where water extraction far exceeds the natural rate of replenishment from rainfall. Measuring these drops requires precise scientific tools to track how much water remains deep beneath the surface of the earth.
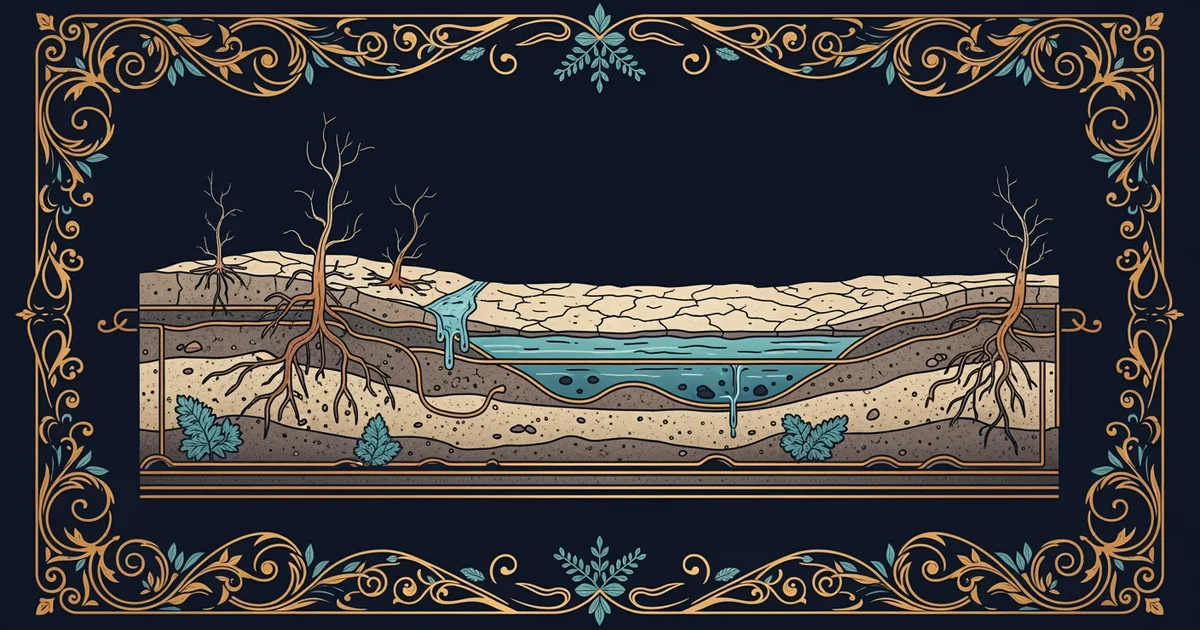
Tracking Declining Water Levels
Scientists track these changes by installing piezometers, which are specialized tubes that measure the pressure of groundwater at specific depths. By recording the depth of the water surface inside these tubes over months or years, researchers can create a clear map of regional decline. This method acts like a dipstick in a car engine, allowing observers to see exactly how much fluid remains in the reservoir. When the water level consistently trends downward across many monitoring sites, it provides undeniable proof that the local water supply is shrinking faster than nature can replace it.
Key term: Piezometer — a narrow pipe inserted into the ground to measure the pressure and depth of the water table.
To visualize the scale of this problem, consider the following factors that influence how we measure these changes in the field:
- Remote sensing satellites measure tiny changes in the gravity field of the earth to estimate total mass, which helps experts calculate the volume of lost groundwater across entire regions.
- Manual field measurements provide the necessary ground truth, ensuring that digital models remain accurate by comparing satellite data with physical water depths observed in active wells.
- Long-term data collection helps distinguish between seasonal dips caused by summer heat and permanent depletion caused by industrial or agricultural over-pumping of the aquifer.
Analyzing Regional Trends and Impacts
Once researchers gather this data, they organize it into tables to compare different geographical areas and their specific rates of decline. This structured approach allows experts to see which regions face the most immediate threat from total aquifer exhaustion. By looking at these patterns, we can identify areas where farming or urban development might become unsustainable within the next few decades. The table below illustrates how different regions might show varying levels of stress based on their unique geological and climate conditions.
| Region Type | Primary Driver | Observed Trend | Risk Level |
|---|---|---|---|
| Agricultural | Crop Irrigation | Rapid Decline | High |
| Industrial | Manufacturing | Steady Drop | Moderate |
| Urbanized | Public Supply | Slow Decrease | Low |
Understanding these trends is essential because groundwater is a finite resource that does not refill quickly. If the water table drops below the reach of existing pumps, communities must invest in deeper wells or face a total loss of access to their local water supply. This transition from abundant water to scarcity often forces difficult economic choices for farmers who rely on irrigation to grow the food we eat. By monitoring these levels closely, we gain the time needed to develop better conservation strategies before the wells run dry permanently. We must treat this hidden resource with the same caution we apply to any other limited bank account balance.
Monitoring the decline of groundwater levels provides the essential data needed to manage our remaining resources before they reach a point of permanent exhaustion.
The next Station introduces economic costs of scarcity, which determines how our reliance on depleting water tables impacts the price of global food production.