
Mapping Global Glaciers
Imagine you are standing on a massive frozen river that flows slower than a human can walk. This giant sheet of ice is a glacier, a permanent body of dense ice that moves under its own weight across the landscape. These icy giants are not just frozen statues, but active geological forces that shape our planet every single day. By mapping where these glaciers exist, we can understand how they store the majority of Earth's fresh water. When we track their locations, we gain a clear view of how our climate changes over many decades.
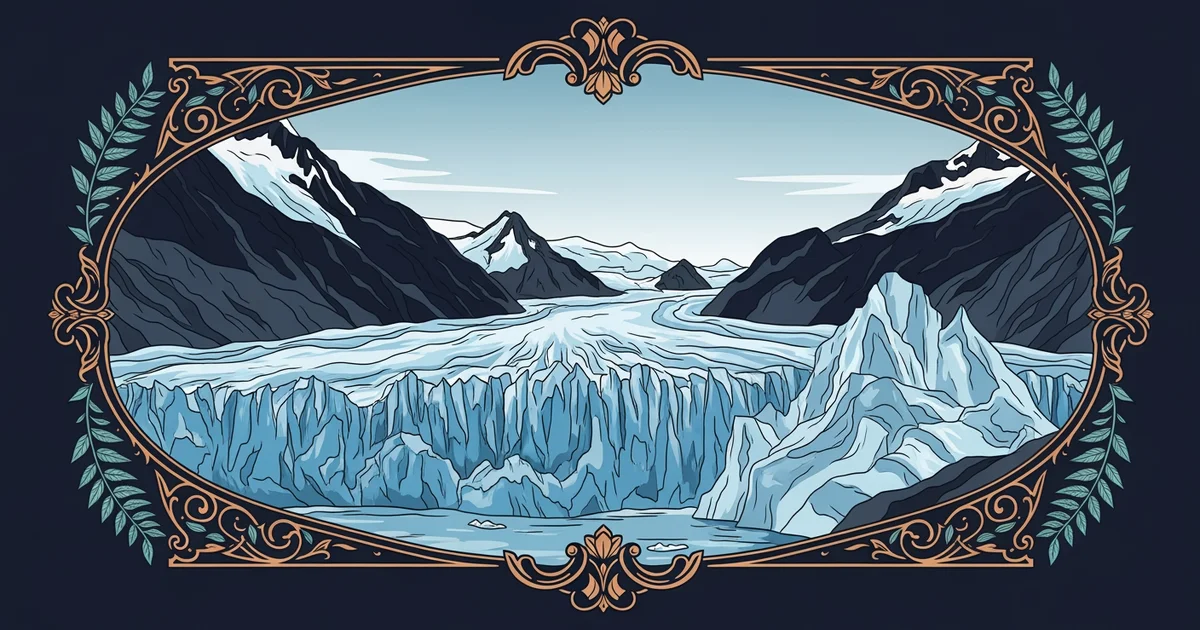
The Global Distribution of Ice
Glaciers are not spread evenly across the Earth because they require specific conditions to survive and grow. Most of the world's ice is locked away in two massive regions known as the polar ice sheets. These regions act like a giant bank account for the planet, holding massive deposits of water that stay frozen for thousands of years. Outside of these polar areas, glaciers appear in high mountain ranges where the air is cold enough to keep snow from melting during the summer months. Much like a business keeping extra cash in a reserve fund, these glaciers hold water in storage for the entire global ecosystem.
To understand where these glaciers sit, we look at three specific zones of activity:
- The Antarctic ice sheet represents the largest single mass of ice on our planet and covers almost the entire southern continent under a thick, frozen blanket.
- The Greenland ice sheet serves as the primary northern reservoir, holding enough water to significantly influence global sea levels if it were to melt away entirely.
- Mountain glaciers found in ranges like the Himalayas and the Andes act as water towers, providing fresh water to millions of people living in the valleys below.
Analyzing Glacial Hotspots
When scientists map these locations, they use satellite data to track how much ice exists in each region. We categorize these areas by their altitude and latitude to see if they are gaining or losing mass over time. This mapping process is similar to a budget audit, where we check if the amount of snow added matches the amount of ice lost to melting or breaking off into the ocean. If the input of snow is lower than the output of melting, the glacier begins to shrink in size and volume.
| Glacial Region | Primary Characteristic | Impact Level |
|---|---|---|
| Polar Sheets | Massive volume storage | Very High |
| Alpine Ranges | Local water source | Moderate |
| Island Caps | Rapid seasonal change | High |
This table helps us identify which glaciers are most at risk during warmer seasons. High-altitude mountain glaciers often respond faster to temperature changes than the massive polar sheets. We pay close attention to these smaller glaciers because they show us the immediate effects of climate shifts. By monitoring these hotspots, we can predict how local water supplies might change in the near future. This data is vital for communities that rely on glacial melt for their drinking water and agricultural needs.
Key term: Cryosphere — the frozen water part of the Earth system that includes snow, sea ice, glaciers, and permafrost.
Understanding the location of these glaciers allows us to see the bigger picture of our planet's health. We see that the cryosphere acts as a global thermostat, reflecting sunlight back into space to keep our temperatures stable. If these regions continue to shrink, the planet absorbs more heat, which leads to further melting in a cycle that is difficult to stop. Mapping these areas is the first step in learning how to protect these vital resources for the future. Every point on the map represents a complex system that supports life far beyond the frozen borders of the ice itself.
Mapping global glaciers reveals the critical state of our planet's water storage and helps us track how climate change alters the landscape.
Next, we will explore how these massive ice structures begin to flow and shift across the terrain as they respond to gravity.