
Statistical Analysis
Imagine you have a giant bag of mixed coins from ten different countries. Sorting them by size is easy, but understanding which country they come from requires a systematic count. Linguists face a similar challenge when they collect thousands of recorded words from different cities. Without a clear way to organize this data, the patterns of human speech remain hidden in the noise. By applying mathematical rigor, we transform raw recordings into a map of how our neighbors actually communicate.
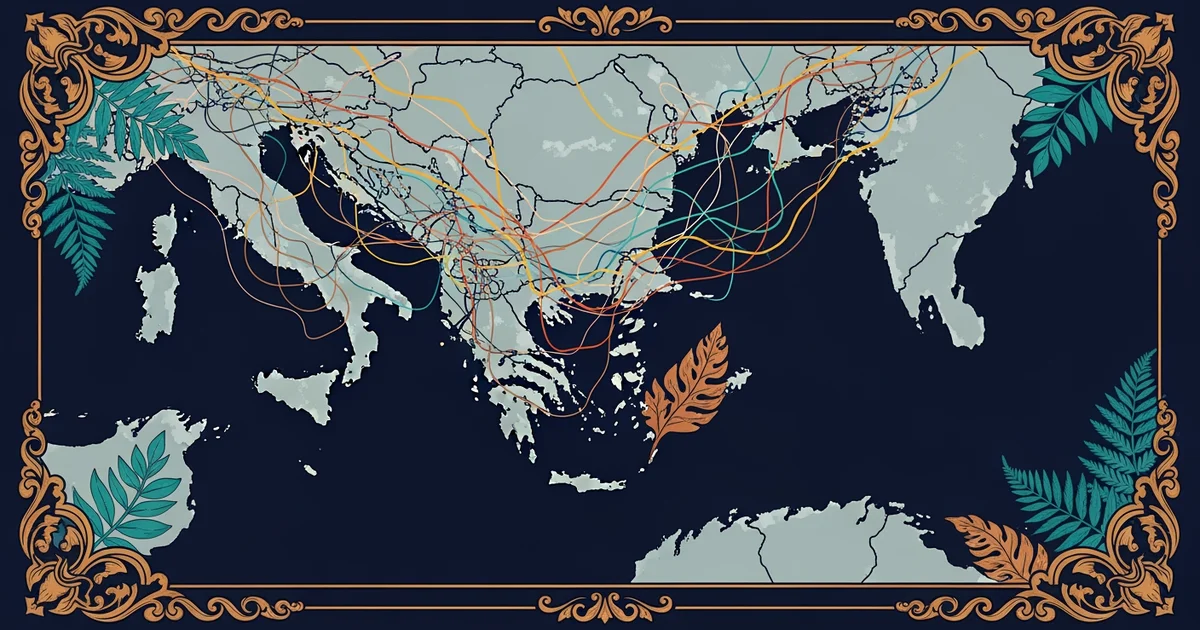
Transforming Spoken Data Into Patterns
When researchers gather speech samples, they often start with a massive, disorganized pile of audio files. To make sense of this, they use quantitative analysis to turn sounds into numbers that represent specific linguistic choices. Think of this process like managing a busy grocery store inventory. You cannot simply guess which items sell the fastest; you must count every single transaction to see the real trends. By assigning numerical values to word usage, you create a structure that allows for objective comparisons between different locations or age groups. This method removes personal bias, ensuring that your conclusions rely on cold, hard evidence rather than mere intuition or guesswork. Once the data is coded, you can see if certain words appear more frequently in specific regions.
Key term: Quantitative analysis — the process of using mathematical and statistical methods to identify patterns within large sets of collected linguistic data.
After the initial coding, you must organize these numbers into a readable format to see the larger picture. A frequency table acts like a scoreboard for your research, showing exactly how often a word appears in each location. This table helps you spot outliers that might otherwise disappear within the larger dataset. If you find that one city uses a specific term significantly more than others, you have discovered a potential linguistic marker. These markers act as breadcrumbs that reveal the history of migration and social interaction within a community. By comparing these tables across different groups, you start to see the hidden boundaries that define our unique regional dialects.
Interpreting Results Through Statistical Mapping
Once you have organized your data, you must determine if the differences you see are truly meaningful. Statistical significance helps you decide if a pattern is a real trend or just a random occurrence. Imagine you are testing a new recipe for a popular dish in your kitchen. If you only serve it to one person, you cannot know if the result represents a general preference. However, if you serve it to one hundred people, you gain a reliable sample size that supports your conclusion. In linguistics, a larger sample size provides the confidence needed to claim that a specific word usage represents an entire community. Without this statistical check, you might mistake a local quirk for a widespread regional habit, leading to incorrect assumptions about the local culture.
| Region | Word Usage A | Word Usage B | Sample Size |
|---|---|---|---|
| North | 85 percent | 15 percent | 500 people |
| South | 20 percent | 80 percent | 500 people |
| West | 55 percent | 45 percent | 500 people |
The table above shows how frequency data reveals clear regional divides in vocabulary. When you look at these percentages, you see that the North and South have distinct preferences for specific terms. The West shows a more balanced usage, which might suggest a mix of influences from other regions. By using these statistical tools, you turn a simple list of words into a visual story of how language moves across a landscape. Each percentage point tells a part of the tale regarding how communities adopt or abandon certain phrases over time. This approach provides the foundation for understanding the complex social variables that influence our daily speech patterns.
Statistical analysis turns raw speech recordings into structured data that reveals the hidden patterns of how we communicate across different regions.
But what does it look like when we start to consider the specific social factors that drive these linguistic differences?