
Mapping Isoglosses
Have you ever noticed how people from different regions use unique words for the same everyday object? You might call a carbonated drink a soda, while someone else just a few counties over calls it pop.
Mapping Linguistic Borders
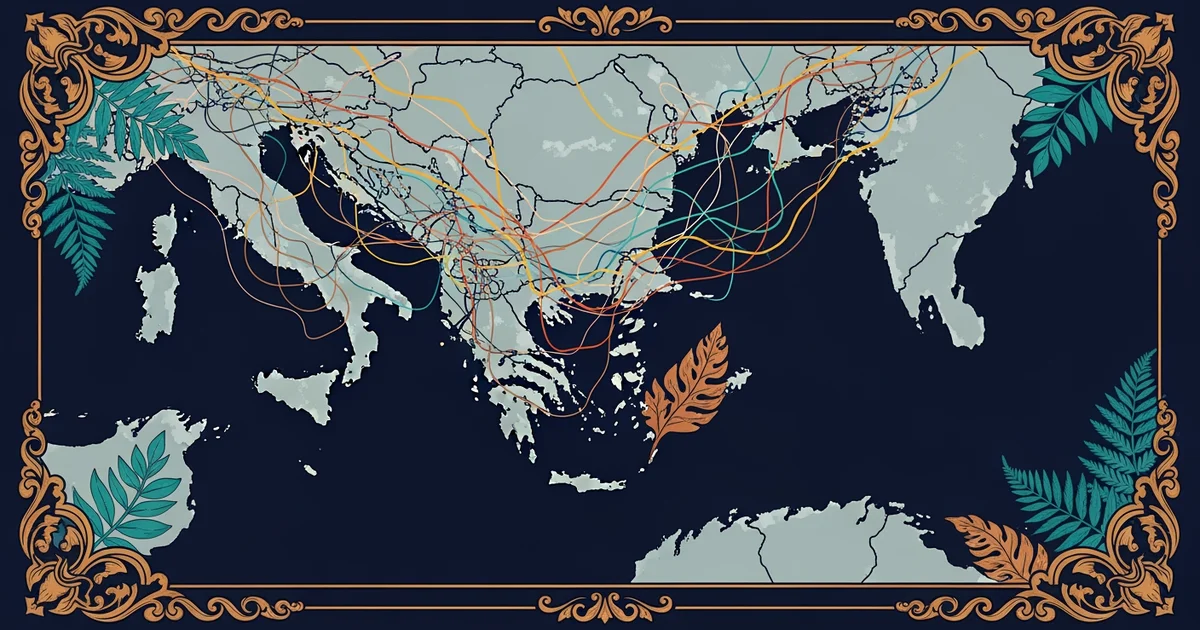
Linguists study these regional differences by creating visual representations of speech patterns across geographic areas. They focus on the isogloss, which acts as a boundary line separating areas where specific linguistic features occur. Think of these lines like the border fences between two different farms that prevent livestock from wandering into the wrong fields. Just as a fence defines the limit of a property, an isogloss defines the edge of a specific word or pronunciation. When researchers collect enough data, they draw these lines on maps to show exactly where one way of speaking shifts into another. These maps turn invisible speech habits into clear, observable patterns that anyone can study and understand.
Key term: Isogloss — a geographical boundary line marking the area where a particular linguistic feature is used.
Drawing these lines requires careful observation of how people speak in various local communities. A researcher might ask a person what they call a sandwich or how they pronounce a specific vowel sound. If everyone in one town uses one term, but everyone in the next town uses a different one, a boundary exists between them. This process helps experts see how language travels across landscapes over long periods of time. The maps reveal that language is not just a random collection of habits but a structured system tied to place. By looking at these patterns, we can see how history and geography shape the way we communicate with others every single day.
Analyzing Regional Variations
When many different isoglosses overlap in the same geographic area, they form a bundle that marks a significant dialect boundary. These bundles are much more important than a single line because they represent major shifts in the way a whole culture speaks. Imagine a highway system where many smaller roads converge at a single major intersection to connect two large cities. A single isogloss is like a small local road, but a bundle of isoglosses acts like a major interstate highway. This convergence tells us that the region is a major divide between two distinct ways of talking. We can categorize these linguistic differences to help us understand the unique character of different regions.
| Feature Type | Description | Purpose of Mapping |
|---|---|---|
| Lexical | Word choices | Identify local vocabulary |
| Phonological | Sound patterns | Map regional accents |
| Grammatical | Sentence rules | Track structural changes |
These categories allow linguists to organize their findings into a clear and readable format for further study. Lexical maps show us how different regions name common items, while phonological maps reveal how vowel shifts create distinct local accents. Grammatical maps track how people build their sentences, which often reveals deeper historical roots. By grouping these features together, we gain a much better understanding of how linguistic identity evolves within a population. Each map provides a piece of the puzzle that explains why our language sounds the way it does today.
Mapping these features helps us visualize the hidden history of our communities and cultures through the lens of speech. When we see where these lines fall, we understand that language is a living, breathing map of human movement. People carry their speech patterns with them when they travel, settle in new areas, and interact with their neighbors. Over time, these patterns settle into the landscape and create the unique dialects we hear today. Studying these maps is like reading a history book that was written by the people themselves through their daily conversations. It allows us to appreciate the diversity of speech as a record of human connection across time and space.
Visualizing speech boundaries through isoglosses allows us to see how geography and human movement shape the way we communicate within our communities.
The next Station introduces Phonological Differences, which determines how specific sound patterns influence the way we draw these linguistic maps.