
Data Filtering Techniques
When scanning the night sky for anomalies, your telescope often captures more than just distant stars. You frequently collect unwanted interference that hides the very objects you aim to study carefully. If you attempt to process every flicker, your system will crash from the sheer volume of useless data. Learning to filter this digital noise is the first step toward finding genuine aerial phenomena.
The Mechanics of Signal Processing
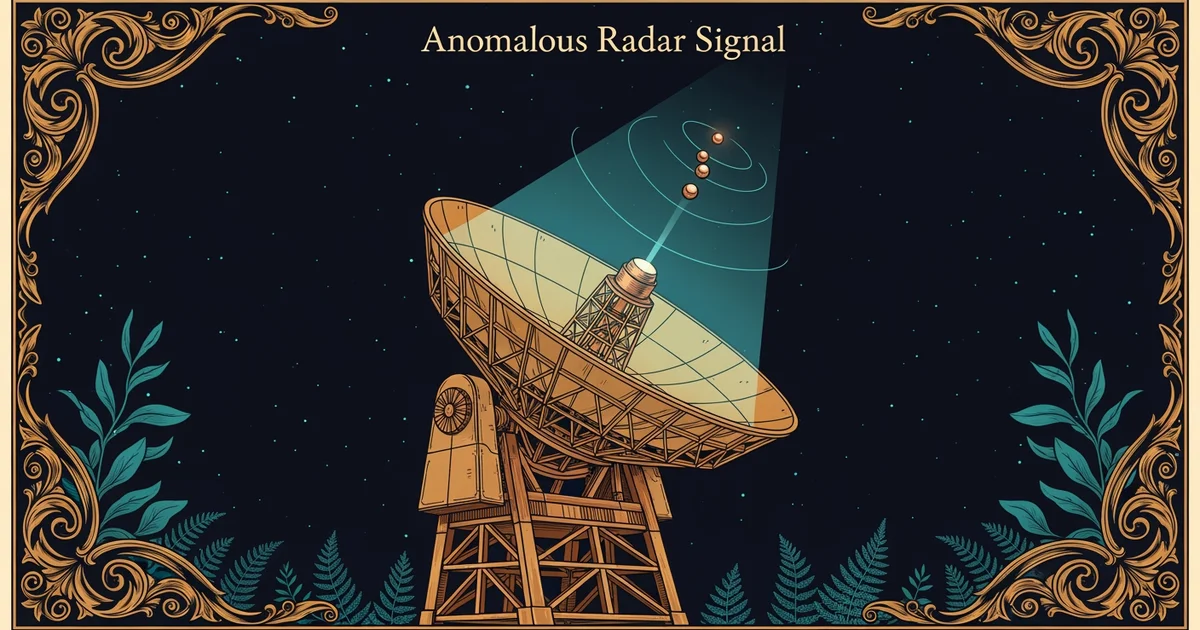
To manage incoming data, scientists use a process called signal conditioning to isolate meaningful information from background interference. Imagine you are trying to hear a quiet conversation in a very crowded, loud city street. You must mentally block out the honking cars and sirens to focus on the specific words being spoken. In astronomy, sensors record millions of data points every single second, but most of these points represent thermal heat or random electronic static. By applying filters, you strip away the digital clutter to reveal the clear, distinct signals hidden underneath.
Key term: Signal conditioning — the process of modifying an electrical signal to make it suitable for further analysis by a computer.
This filtering process relies on mathematical thresholds that act as gates for incoming information. If a data point falls below a certain energy level, the system automatically discards it as meaningless background noise. This ensures that only high-intensity events, which might indicate an object moving through the field of view, are sent to your storage drives. Without these strict gates, your computer would waste precious processing power on empty space or flickering pixels. You create a cleaner environment for your software to identify patterns that actually matter for your research goals.
Applying Digital Thresholds
Once you have established your baseline, you can implement specific techniques to refine your detection capabilities further. One common method involves comparing frames over time to see what remains constant versus what changes rapidly. If a light source appears in the same spot for hours, it is likely a distant star or a sensor error. However, an object that shifts its position across multiple frames suggests a moving target that requires your immediate attention. By using these comparison tools, you transform raw, messy input into a structured dataset ready for deep analysis.
| Filter Type | Primary Function | Ideal Use Case |
|---|---|---|
| Low-pass | Blocks high noise | Steady signals |
| High-pass | Blocks slow drift | Rapid movement |
| Band-pass | Targets specific | Known frequencies |
These filters allow researchers to categorize data based on how it behaves during the observation period. You can see how each filter serves a unique purpose in the following list:
- Temporal filtering removes data that does not repeat or change in a way that matches known physics, preventing random glitches from being mistaken for real objects.
- Spatial filtering ignores light sources that are too large or too small to be physical craft, effectively narrowing your search to relevant aerial dimensions.
- Amplitude thresholding sets a minimum brightness requirement, ensuring that only signals with enough energy to be significant are recorded for later study and review.
By layering these techniques, you build a robust system that ignores the static of the universe. This approach saves time and ensures that your final reports contain only high-quality, actionable evidence. You are essentially building a custom sieve that catches only the most interesting pieces of information from a massive river of data. This methodical clearing of the path allows you to focus your limited resources on investigating objects that truly defy standard flight characteristics.
Data filtering acts as a digital sieve that discards irrelevant background noise to isolate significant aerial events for scientific study.
The next Station introduces radar anomaly identification, which determines how filtered signals are verified as physical objects.