
The Purpose of Visual Data
Imagine you are trying to find the fastest route through a city during heavy traffic. You could stare at a list of thousands of street names and speed limits, but that would take hours to process. Instead, you glance at a digital map that uses color-coded lines to show traffic flow instantly. This simple shift from raw data to a visual format allows your brain to identify the best path in mere seconds. Visualizing data acts as a bridge between complex information and human understanding by highlighting patterns that remain hidden in lists.
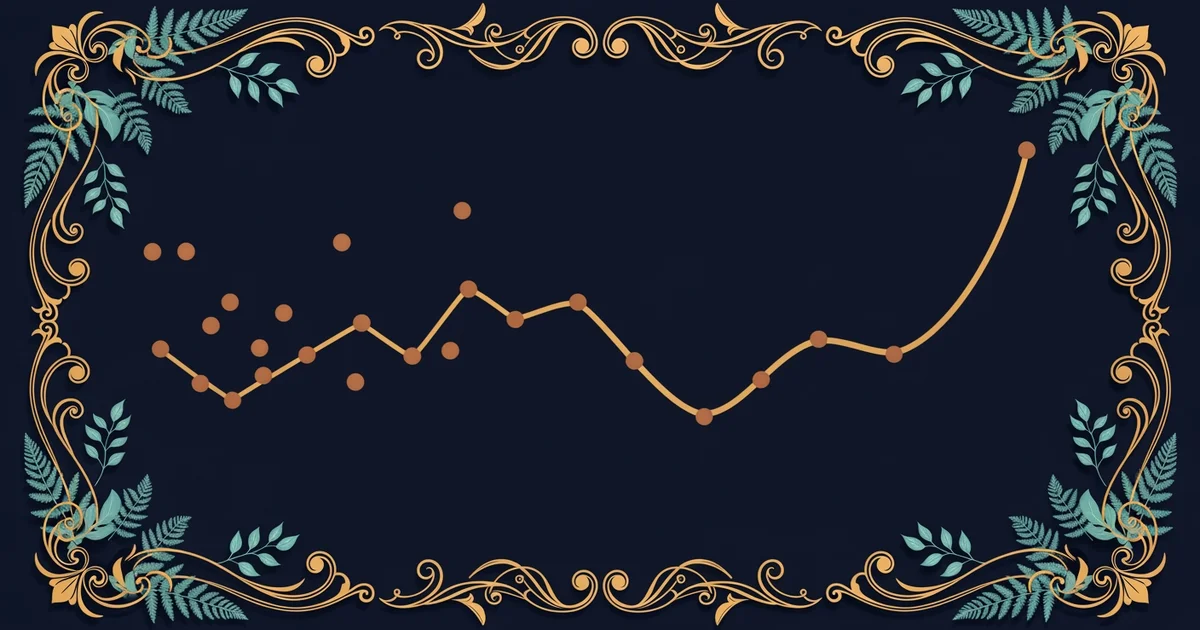
The Function of Visual Representations
When we look at numbers, our brains struggle to see the big picture because we are not built to process massive spreadsheets. We naturally seek out patterns, shapes, and colors to make sense of our surroundings. By converting raw data into charts or graphs, we simplify the information so our cognitive systems can interpret it without extra effort. Think of this like a financial budget for a household. If you simply write down every single expense on a scroll, you will likely miss the trend of rising costs. If you plot those same expenses on a bar chart, the spikes in spending become obvious, allowing you to make smarter choices about your money.
Key term: Data visualization — the practice of turning raw numerical information into graphical formats to make patterns easier to identify.
This process is essential because it saves time and reduces the chance of human error during analysis. When information is presented visually, the brain uses its powerful pattern-recognition skills to spot outliers or trends that a simple list would completely obscure. This capability is vital in fields ranging from medicine to engineering. By using visual tools, we can communicate findings to others who might not have the same technical background as the person who gathered the data. It democratizes information by making complex truths accessible to everyone who needs them.
Why Brains Prefer Visual Formats
Human brains are wired to prioritize visual inputs over textual ones because images provide context that words often lack. When you see a map, you immediately understand the distance between two points without needing to read a single coordinate. This efficiency is the primary reason we use visual formats to represent large datasets. The following table compares how our brains handle raw lists versus visual displays of information.
| Feature | Raw Numerical List | Visual Data Display |
|---|---|---|
| Speed | Slow to process | Very fast to grasp |
| Patterns | Hidden from view | Instantly visible |
| Context | Lacking depth | Rich with meaning |
| Accuracy | Higher error risk | Lower error risk |
By organizing data into these clear formats, we allow our minds to focus on the meaning behind the numbers rather than the struggle of reading them. This shift allows us to move from simply observing information to actually understanding it. We can then use these insights to make better decisions in our daily lives, whether we are managing personal time or analyzing global trends. The goal of any good chart is to strip away the noise and leave only the most important signals for the viewer to see.
There are several reasons why visual formats are superior for conveying information to a wide audience:
- Visuals help us compare different values side-by-side, which allows for quick judgments about which items are larger or smaller without needing to compare exact digits.
- Graphical formats highlight trends over time, such as how temperature changes across a year, by using lines that show a clear direction or slope.
- Charts group similar pieces of information together, which helps the viewer see how different categories relate to each other within a larger set of data.
Visualizing data transforms complex numbers into clear stories that reveal hidden truths about the world by using the brain's natural ability to recognize patterns.
This foundation provides the skills you need to master the art of turning raw information into meaningful insights throughout this entire path.