
Mapping Social Circles
Imagine you are standing in a crowded room where every person is holding a thin, invisible string. When you reach out to shake a hand, you create a physical link that connects your life to theirs in a lasting way. This simple action turns a random group of strangers into a structured group with clear, defined patterns of interaction. By mapping these connections, we can see how small, personal choices eventually build the complex social structures that define our modern human experience.
The Anatomy of Social Connections
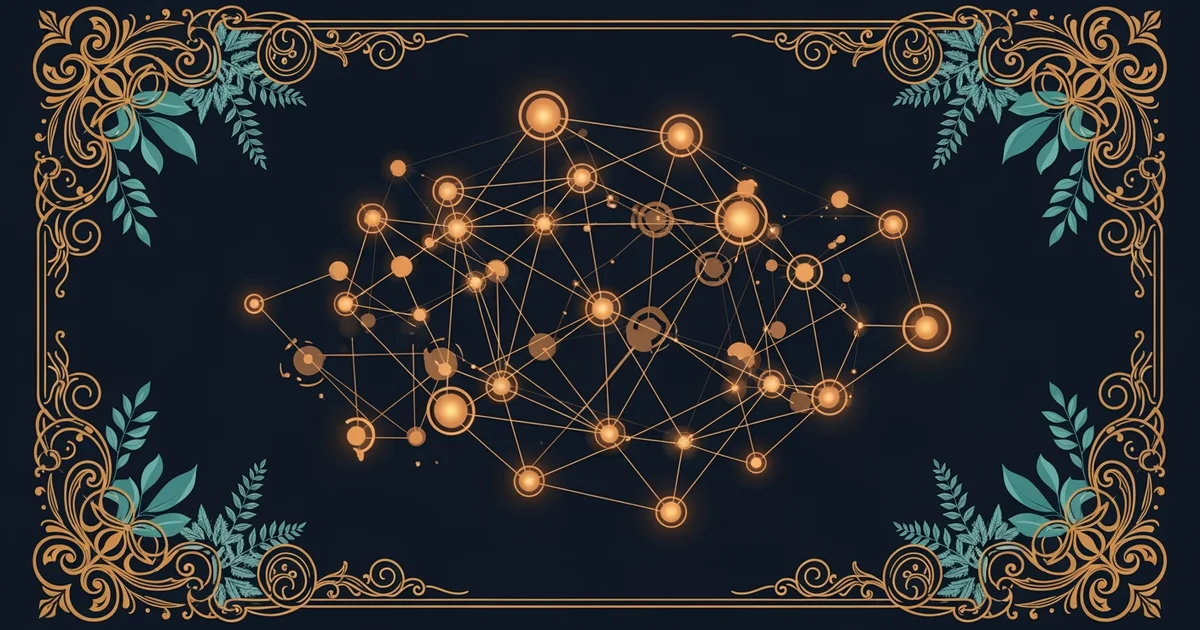
When we look at social groups, we are actually looking at a social graph that maps how individuals relate to one another. Each person in this system acts as a point, or node, while every relationship acts as a line, or edge, connecting those points together. Think of this like a massive digital map of a city where every road represents a friendship or a shared contact between two people. If you have many connections, you act as a central hub that helps information move quickly across the entire system. Without these specific links, the group would remain a collection of isolated individuals with no way to share resources or ideas.
Key term: Social graph — a visual representation of the relationships and connections existing between a set of people or entities within a network.
To understand how these patterns function, we must consider how distance changes the way information flows through the group. In a small, tight circle, everyone knows everyone else, which makes communication very fast and highly reliable for the members. As the group grows larger, the number of possible connections increases at a much faster rate than the number of people. This rapid growth means that even in a group of one thousand people, you are likely only a few steps away from any other person. This phenomenon shows that our social world is much smaller and more connected than it first appears to our human eyes.
Patterns of Human Interaction
When we map these circles, we often find that people tend to cluster into dense groups where everyone knows each other quite well. These clusters are similar to small neighborhoods within a large city where people share similar interests or daily routines. We can categorize these interactions based on how they influence the overall structure of the network through specific roles.
| Connection Type | Primary Function | Impact on Network |
|---|---|---|
| Strong Ties | Build trust | Create dense, local clusters |
| Weak Ties | Bridge gaps | Connect separate, distant groups |
| Central Nodes | Manage flow | Speed up system communication |
These roles are essential for keeping the entire system healthy and functional for every person involved in the network. Strong ties provide the emotional support that keeps a small group stable over long periods of time. Weak ties, however, act as the bridges that allow new ideas to travel from one cluster to another. If you only had strong ties, your information would be limited to what your immediate friends already know. By maintaining a mix of both, you ensure that your social circle remains open to new, helpful information from the outside world.
To visualize this, imagine a busy marketplace where merchants trade goods across many different stalls in the city. The merchants who stay in one stall build strong relationships with their regular customers who visit every day. Meanwhile, the traveling merchants who move between different areas of the market act as the vital connectors for the whole group. These travelers bring news of new products or price changes from distant stalls back to the local merchants. Without these traveling connections, the entire market would stagnate because no new information or resources could ever reach the isolated stalls. Your own social life works in exactly this same way by balancing your close friends with your broader, more distant acquaintances.
Understanding the structure of our social connections reveals how individual relationships combine to form the complex, invisible patterns that shape our collective behavior.
Next, we will explore how these social maps are translated into the formal language of graphs to better predict how information spreads.