
Global Integration Systems
Imagine trying to navigate a vast, dark forest using only a hand-drawn map from a century ago. You would likely miss modern trails or fail to account for new rivers that changed the landscape over time.
Integrating Historical Data With Digital Mapping
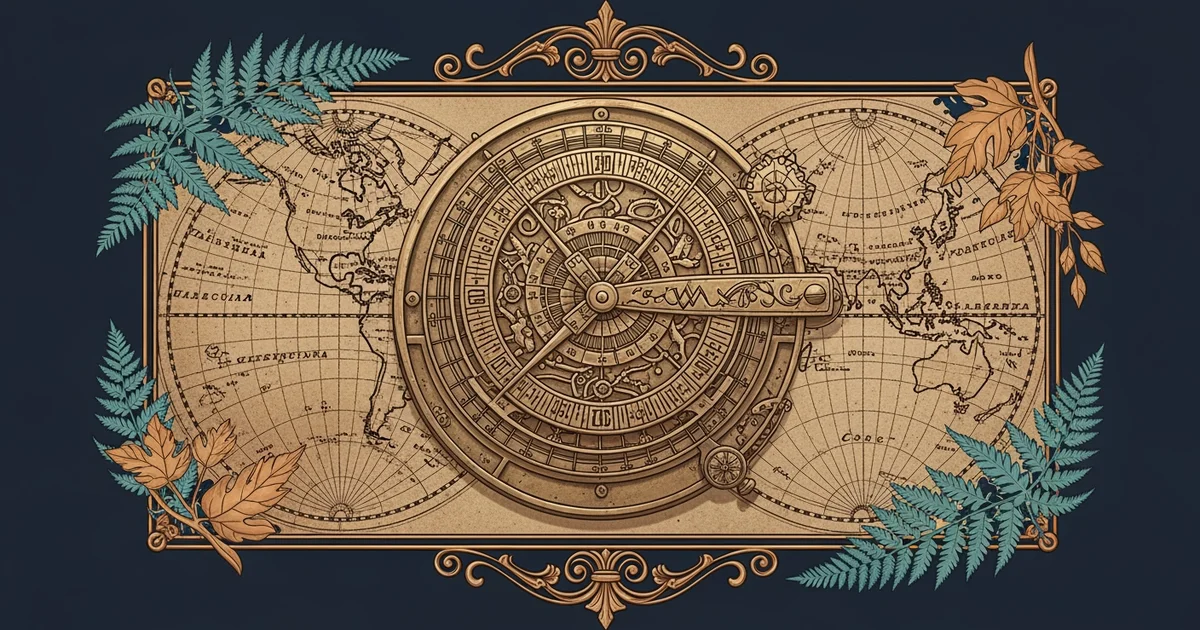
Modern exploration relies on our ability to combine ancient records with high-precision digital tools. When we look at the history of human curiosity, we see a shift from simple sketches to complex satellite imagery. These older records act like a rough foundation for a house, while modern data provides the walls and roof. By layering these datasets, scientists create a digital twin of the Earth that shows how environments evolve over decades. This process allows us to see past patterns, such as forest growth or ice retreat, alongside current weather and terrain data. Just as a business owner tracks sales growth to predict future revenue, geographers track environmental shifts to understand our planet’s health. Integrating these layers helps us solve the mystery of how human curiosity changed our view of the global landscape over time.
Key term: Digital twin — a virtual model of a physical object or system that uses real-time data to mirror the state of the original entity.
We must consider how these systems interact with previous discoveries to build a complete picture of Earth. For example, our research in polar regions showed that ice shelves are moving faster than we once thought. When we layer that new information onto older, static maps, the discrepancy becomes clear. This tension between what we knew and what we see now drives discovery forward. It forces us to ask why our previous assumptions failed to account for rapid change. This is the heart of synthesis: we do not discard the old records, but we use them to measure the pace of our current transformation. By comparing the two, we gain a much clearer understanding of the global landscape than any single source could provide alone.
The Mechanics of Global Integration Systems
Systems for global integration function like a massive digital library where every book is cross-referenced in real-time. Each data point serves as a unique entry that connects to others based on location, time, or environmental variables. This interconnectedness allows researchers to identify trends that would remain hidden in isolated datasets. When we combine historical charts with modern sensor data, we build a robust framework for understanding change. This framework relies on three main components to ensure accuracy and depth for all users:
- Data harmonization aligns different formats of information so that old paper maps and modern digital files can exist in the same space.
- Spatial indexing organizes geographical data by coordinates, which ensures that every piece of information lands in the exact right place on the globe.
- Temporal layering allows us to view the same location across different time periods, providing a clear visual history of how the area has changed.
These components work together to turn raw data into actionable knowledge that anyone can study. Without this integration, we would be left with scattered facts rather than a cohesive story about our world. The synthesis of these systems proves that our curiosity is not just about finding new places, but about understanding how every place connects to the whole. As we refine these tools, we move closer to a perfect, living model of our planet. This progress answers the foundation question by showing that curiosity drives us to constantly improve the accuracy of our global perspective.
True global understanding emerges only when we synthesize historical records with real-time data to reveal the patterns of our changing world.
Future exploration frontiers will rely on these integrated systems to navigate the unknown challenges of our planet's next chapter.