
Cartography and Visualization
Imagine you are trying to find the best route across a vast, unfamiliar forest without a guide. You would likely sketch the landmarks you see to ensure you do not wander in circles for hours. This simple act of drawing what you see is the fundamental starting point of human exploration and spatial understanding. Cartography began as a way to preserve these observations, turning fleeting personal experiences into permanent records that others could follow. By documenting the landscape, early people transformed their survival instincts into a shared language of space, direction, and distance.
The Evolution of Mapping Techniques
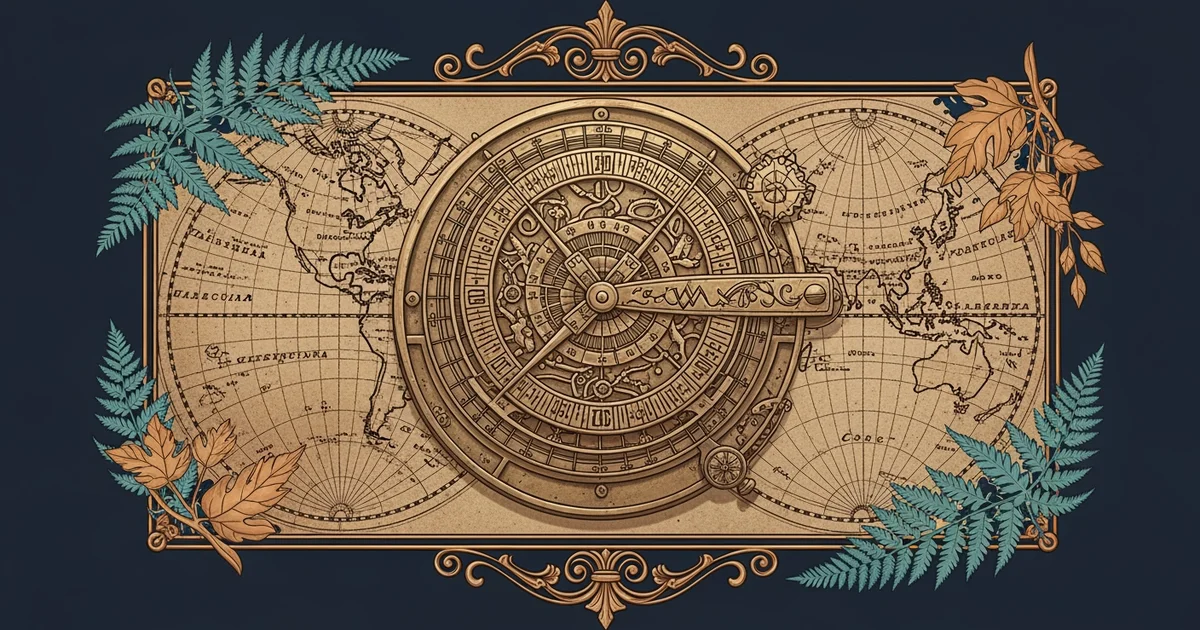
As human societies grew, the need for accurate geographic data became essential for trade, defense, and governance. Early maps were often artistic representations that prioritized cultural importance over precise physical measurements of the Earth. These documents served as visual stories, highlighting sacred sites or mythical lands rather than providing a reliable path for navigation. Over time, explorers realized that these artistic sketches were insufficient for long-distance travel across oceans or mountains. They needed a more systematic approach to represent the world, leading to the development of cartography as a rigorous discipline. This shift required moving away from subjective drawings toward objective measurements based on geometry and mathematics.
Key term: Cartography — the science or practice of drawing and creating maps to represent geographic spaces accurately.
Think of this transition like upgrading from a hand-drawn sketch of a house to a detailed architectural blueprint. A sketch might capture the vibe of the home, but it lacks the exact measurements needed to build a safe structure. Similarly, early maps captured the spirit of a region, but scientific projections provide the structural integrity required for precise global navigation. By adopting mathematical principles, mapmakers could finally account for the curvature of the Earth on a flat surface. This evolution turned maps from decorative wall hangings into vital tools for global exploration and scientific discovery.
Scientific Projections and Data Accuracy
Once mathematicians began applying geometric principles to the globe, they encountered the challenge of representing a sphere on a flat plane. This problem is known as a projection, which inevitably introduces some level of distortion to the map. To manage this, cartographers developed specialized map projections that prioritize specific features like distance, shape, or area depending on the intended use. Understanding these trade-offs is necessary for anyone reading a map, as no single projection can perfectly capture all aspects of the Earth simultaneously. The following table highlights common projection types used to balance these competing geographic needs:
| Projection Type | Primary Focus | Best Use Case |
|---|---|---|
| Mercator | Preserves Angles | Marine navigation and sea travel |
| Gall-Peters | Preserves Area | Comparing the size of continents |
| Robinson | Visual Balance | General reference and world maps |
These projections allow us to translate complex geographic data into a format that the human brain can easily process. By selecting the right tool for the job, we can minimize errors while maximizing the utility of the information provided. The shift toward scientific accuracy did not just improve travel; it changed how we perceive our place within the global landscape. We moved from seeing the world as a mysterious collection of regions to viewing it as a measurable, interconnected system. This scientific mindset remains the foundation for how we navigate the modern world today.
Scientific mapmaking converts the complex, curved reality of our planet into precise, flat visual data that enables reliable navigation.
The next Station introduces Celestial Navigation Methods, which determines how early explorers used the stars to refine their global positioning.