
Exoplanet Visualization
When researchers at the Kepler Space Telescope analyzed light dips from distant stars, they realized that flat data points could reveal hidden worlds. Much like a detective reconstructing a crime scene from blurry security footage, scientists use mathematical models to turn sparse light curves into detailed planetary surfaces. This process, known as astro-photogrammetry, allows us to visualize worlds that are trillions of miles away. By measuring how light changes over time as a planet orbits its host star, we can infer the shape and composition of the distant surface. This is the application of the data processing techniques from Station 12, but now we apply them to the complex geometry of rotating spheres.
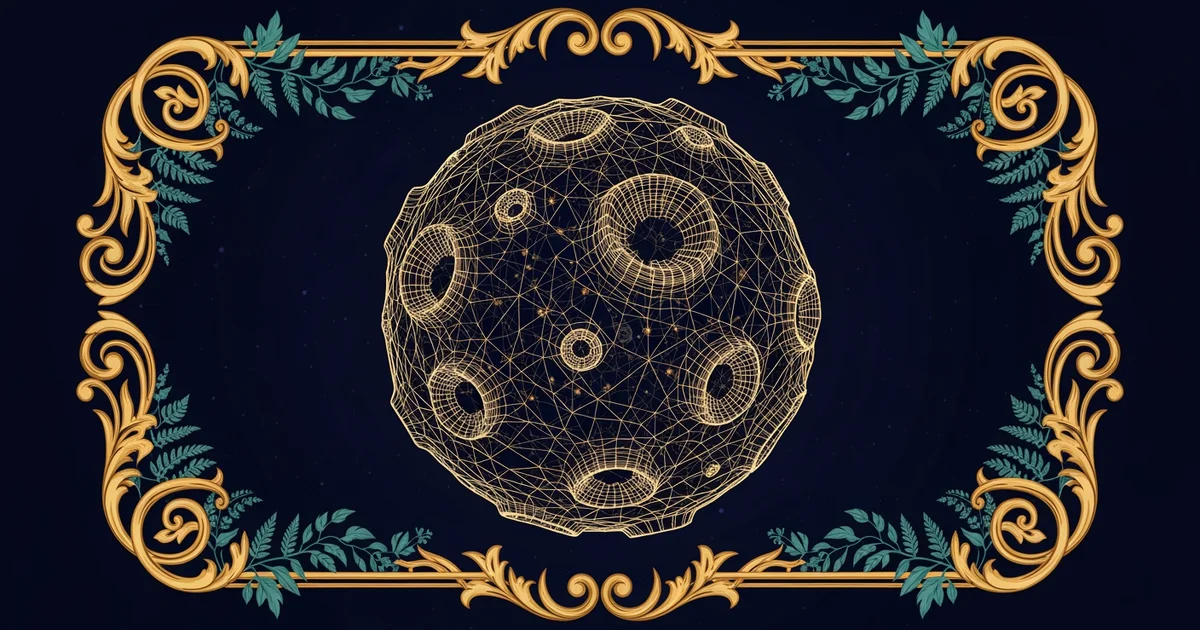
Mapping Light to Physical Form
To build a 3D model, we first analyze the way a planet blocks light as it passes in front of its star. This regular drop in brightness, called a light curve, acts as a fingerprint for the planet's size and orbital path. Imagine trying to guess the shape of a spinning toy by only watching its shadow on a wall. If the shadow changes in a specific way as the toy rotates, you can deduce whether it is a smooth sphere or a jagged rock. Astronomers perform this same task by using advanced algorithms to interpret the subtle variations in light intensity. These variations reveal surface features like craters, mountains, or even vast oceans that reflect light differently than dry land.
Key term: Light curve — a graph showing the change in a star's brightness over time as a planet passes across its face.
Once the light curve data is collected, we apply computer models to simulate the planet's rotation and surface texture. We compare the observed data against thousands of generated models to see which one matches the real-world signal. This process is similar to how a budget analyst reconstructs a company’s spending habits by looking only at the final monthly balance sheet. If the total expenses fluctuate in a certain pattern, the analyst can infer which departments spent the most money. In our case, the light intensity acts as the bank balance, and the surface features act as the individual spending categories. We refine these models until the digital recreation matches the observed light patterns with high accuracy.
Enhancing Resolution with Data Integration
After creating a basic model, we must account for the fact that light travels across vast distances and loses clarity. We use sophisticated software to sharpen these images by filtering out interference from the star's own light. This step is critical because the star is often millions of times brighter than the planet. Without these filters, the planet would be invisible against the brilliant glare of its parent star. We can categorize the types of surface data we extract using the following table to track our progress:
| Data Feature | Measurement Method | Physical Inference |
|---|---|---|
| Transit Depth | Light curve dip | Planetary radius |
| Phase Angle | Reflected brightness | Surface reflectivity |
| Periodicity | Time between dips | Orbital distance |
By organizing the data this way, we ensure that every piece of information contributes to the final 3D reconstruction. This systematic approach allows us to confirm if a planet is likely a rocky world or a gas giant. The process relies on the assumption that light behaves consistently across the universe, allowing us to map distant photons to local physical properties. We constantly update our models as new data arrives from newer, more powerful space telescopes that capture higher resolution light signals.
Each new observation helps us refine the 3D geometry of these distant worlds. We look for patterns in the light that suggest clouds, seasons, or even surface vegetation. While we cannot visit these places, the math allows us to see them as clearly as if we were in orbit. This transforms raw numbers into a vivid picture of a living, breathing universe beyond our own solar system. We are essentially building a digital map of the galaxy, one light curve at a time, to understand the diversity of worlds that exist in the dark void.
Transforming light curve data into 3D models allows us to map the physical characteristics of distant planets by interpreting how they block and reflect starlight over time.
But this model breaks down when the planet’s atmosphere creates significant light scattering or haze that obscures the true surface features.