
Public Health Inference
During the 1854 cholera outbreak in London, Dr. John Snow mapped illness clusters to specific water pumps. He proved that contaminated water caused the disease, shifting public health from guessing to evidence-based action.
Identifying Hidden Disease Drivers
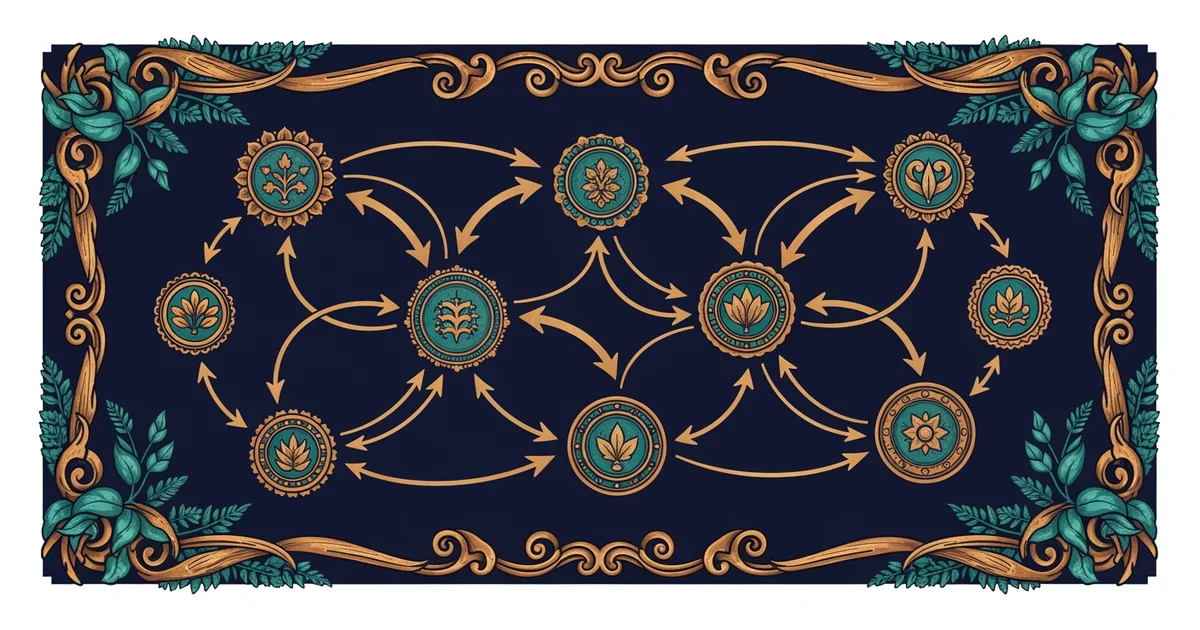
Public health experts use causal inference to determine if a specific behavior or environmental factor truly triggers a health outcome. When scientists observe that people who exercise more have fewer heart issues, they must separate the exercise from other factors like diet or genetics. This is similar to a store manager who notices sales rise when they play upbeat music. The manager must confirm that the music causes the sales increase rather than the time of day or a seasonal holiday event. By using structured models, researchers isolate the specific variable that impacts the health of a population.
To ensure results are valid, researchers often use a control group to compare outcomes against a group that did not experience the exposure. If the data shows a strong link, they apply statistical tests to remove the chance that the result happened by random luck. This process requires careful tracking of data over long periods to see if the outcome changes when the suspected cause is removed. When the cause is removed and the health issue declines, the link becomes much stronger and more reliable for policy makers.
Mapping Transmission Routes
When tracking how a virus moves through a community, experts look for specific patterns that reveal the source of the infection. They often use a transmission model to simulate how individuals interact and spread pathogens across different social groups. These models help health officials predict the future spread of a disease so they can allocate resources where they are needed most. By understanding the path of a virus, teams can implement targeted interventions that stop the spread before it reaches vulnerable groups or overwhelms local hospitals.
Health officials track these variables to make informed decisions about public safety and resource distribution:
- Incubation period describes the time between initial exposure to a pathogen and the first appearance of symptoms — knowing this helps officials set quarantine times that effectively stop new infections.
- Contact rate measures how often an infected person interacts with healthy people in a given day — higher contact rates force officials to implement social distancing measures to reduce the total spread.
- Recovery rate tracks how quickly an infected person becomes non-infectious after receiving treatment — this data allows hospitals to manage bed capacity and predict when the peak of an outbreak will pass.
| Variable | Purpose | Impact on Policy |
|---|---|---|
| Exposure | Identify source | Targeted cleanup |
| Isolation | Stop spread | Quarantine rules |
| Vaccination | Build immunity | Prevent outbreaks |
This table shows how different variables guide specific actions that protect the general public from widespread harm. By focusing on these factors, teams can move beyond simple observation and start building models that save lives. Every data point acts as a piece of a puzzle that, when assembled, provides a clear picture of how to improve community wellness through logic and math.
Public health inference uses rigorous statistical isolation to distinguish genuine disease causes from mere coincidental patterns in human behavior.
But this model breaks down when social biases influence the collection of health data and distort the final results.