
Clustering and Vector Spaces
Imagine two authors standing in a vast empty room where each step represents a unique word choice. If these writers share a style, their footprints will land close together on the dusty floor.
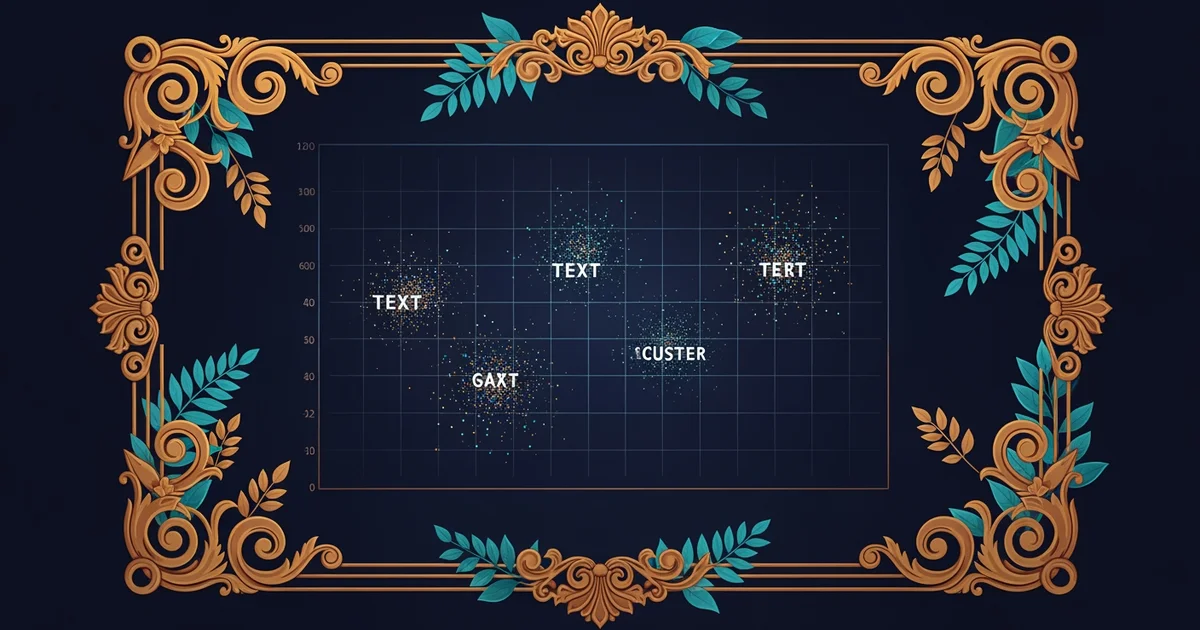
Mapping Language Through Vector Spaces
When we represent text as data, we turn sentences into lists of numbers that computers can process. This process begins by counting how often specific words appear within a given document. These counts form a vector, which acts like a coordinate point in a multi-dimensional graph. By treating every unique word as a separate dimension, we create a mathematical map of the entire text. This map allows us to measure how similar two writing samples are by calculating the distance between their points. If two documents occupy the same area in this space, they likely share a common author or intent. Think of this like a library where books are sorted by the frequency of their vocabulary instead of by their covers.
Key term: Vector — a mathematical object that represents a list of numbers, used here to map the frequency of words in a document.
Because language is complex, we must normalize these counts so that shorter texts are comparable to longer ones. A short essay might have fewer total words than a novel, but its word usage patterns might still match perfectly. We achieve this by converting raw counts into percentages or relative frequencies of the total word count. Once normalized, the vectors become comparable regardless of the document length or the total word count. This normalization acts like adjusting a recipe for different serving sizes while keeping the taste profile identical. When we compare these adjusted vectors, we see the hidden structure of the author's personal style emerge clearly.
Measuring Similarity With Mathematical Clusters
After we map our documents into this space, we must identify which ones belong to the same group. This process is called clustering, where we group points that sit near each other in the vector space. We use algorithms to find these natural groupings, which often reveal distinct authorial signatures hidden within the data. These clusters provide visual evidence of authorship by showing how closely related texts group together on the graph.
We can organize these text groups using different metrics to see how they relate to one another:
- Euclidean distance measures the straight-line path between two points, helping us see the raw physical gap between different authors.
- Cosine similarity measures the angle between two vectors, which ignores the total document length to focus purely on word distribution patterns.
- Centroid calculation finds the average position of a cluster, allowing us to identify the core signature of an anonymous writer.
When we analyze these clusters, we can determine if a mystery text belongs to a known author. If the new document falls into an existing cluster, we have found a likely match for the writer. This method works because authors tend to repeat their favorite vocabulary choices in consistent patterns over time. Just as a shopkeeper tracks inventory to see which items sell together, we track word usage to see which writing styles belong together. By visualizing these clusters, we turn abstract linguistic habits into concrete, measurable data points that reveal the truth behind anonymous writing.
Clustering turns messy human writing into precise mathematical maps that reveal the hidden connections between different authors.
But what does it look like when we simplify these complex multi-dimensional maps into a single flat image?
Want this with sources you can check?
Premium Learning Paths for Literature & Linguistics are researched against open-access libraries — PubMed, arXiv, government databases, and more — with their distinctive claims cited to real sources and independently checked.
See what Premium includes