
Feedback Loops Integration
When the Netflix recommendation engine suggests a movie you enjoy, it is not guessing randomly. It uses a complex system to learn from your past clicks and viewing habits. This is a real-world example of a feedback loop in action. Without this constant stream of data, the system would remain static and quickly become outdated for users. Developers use these loops to bridge the gap between static code and dynamic user needs. By capturing real usage data, teams ensure their models improve over time instead of decaying.
Establishing Data Pipelines for Learning
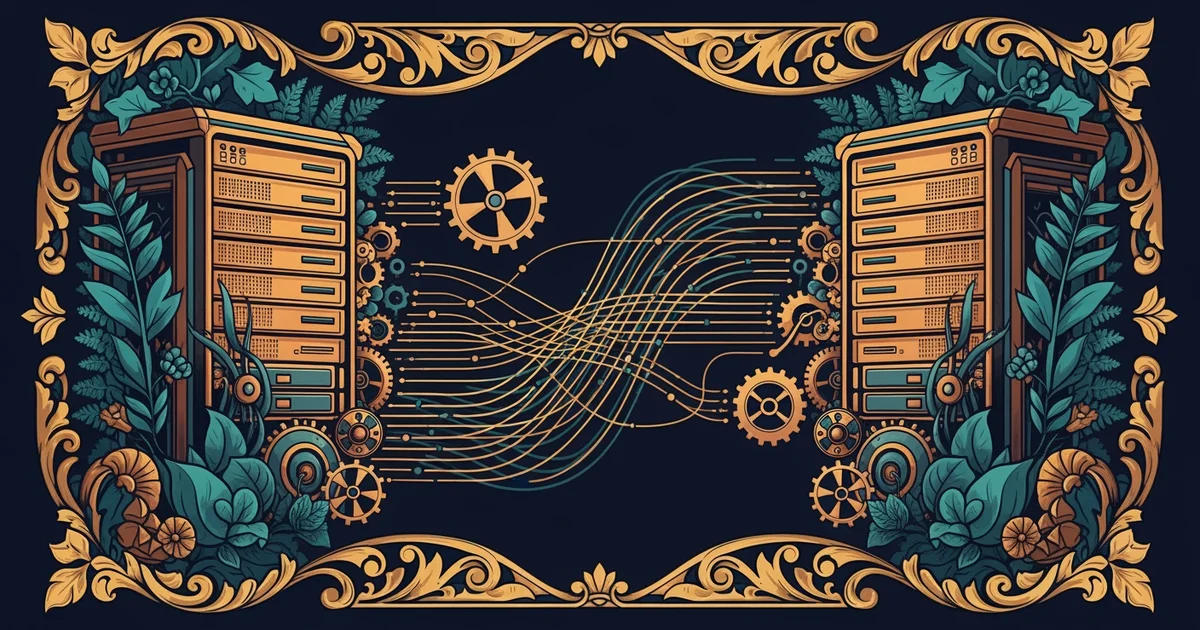
To build a working feedback loop, you must first create a reliable path for data. This path moves information from the production environment back to your development team for analysis. Think of this process like a restaurant manager watching plates return to the kitchen. If customers leave half their meal, the manager knows the recipe needs a change. This is the Feedback Loop Integration concept, which helps developers identify when a model fails to meet user expectations. You must capture clear signals that show how well the model performs in daily tasks. These signals often include click rates, error reports, or manual user ratings. Once these signals reach the developer, they can adjust the model to fix identified gaps.
Key term: Telemetry — the automatic process of collecting and transmitting data from remote sources for monitoring and analysis.
Effective systems rely on automated triggers to manage this incoming flow of information. You cannot manually check every single prediction your model makes in a live environment. Instead, you design systems that flag outliers or low-confidence results for immediate review. These flagged items provide the most value because they represent the edges of your model's knowledge. By focusing on these specific points, you save time and improve the model where it struggles most. This approach is much more efficient than trying to retrain the whole system every single day.
Measuring System Performance Over Time
Once you have your data, you need a way to compare new results against your old targets. This comparison helps you decide if the model is actually getting better or just changing. You should maintain a performance dashboard that tracks key metrics over a long period. This allows you to spot trends that might indicate the model is drifting away from its original purpose. The following table shows how different feedback signals help teams make decisions about their machine learning models.
| Signal Type | Primary Goal | Action Taken |
|---|---|---|
| Click Rate | User Interest | Update Ranking |
| Error Logs | Bug Detection | Fix Logic Paths |
| User Rating | Satisfaction | Retrain Weights |
Using this table, you can see that not all data points serve the same purpose. A click rate tells you about engagement, while an error log points to technical failures. Teams must balance these signals to create a complete picture of the system health. If you only look at one type of data, you might miss the full story of your performance.
- Identify the specific metric that matters most for your model success.
- Create an automated pipeline to send this metric to your dashboard.
- Set alerts for when the metric drops below your acceptable levels.
- Review the flagged data to find patterns in the model errors.
- Retrain the model using the new data to improve future results.
Following these steps ensures that your model evolves alongside your users. This creates a cycle where the system becomes smarter with every single interaction it records. Without this structure, models become stagnant and lose their value to the end user. You are not just building software; you are building a system that learns from its own experience.
Successful model deployment requires continuous data streams that allow developers to refine predictions based on real user behavior.
But this process faces significant risks if the training data contains hidden biases that amplify over time.