High Frequency Monitoring
During the 2010 Flash Crash, market participants watched in horror as prices plummeted within mere minutes. This sudden collapse occurred because automated systems failed to handle the extreme volume of incoming data. This event serves as a stark reminder of why constant oversight is vital for modern financial systems. When trading algorithms operate at speeds faster than a human can blink, they require robust tools to track their health. Without active monitoring, a system might continue to execute flawed trades long after a technical error begins to unfold.
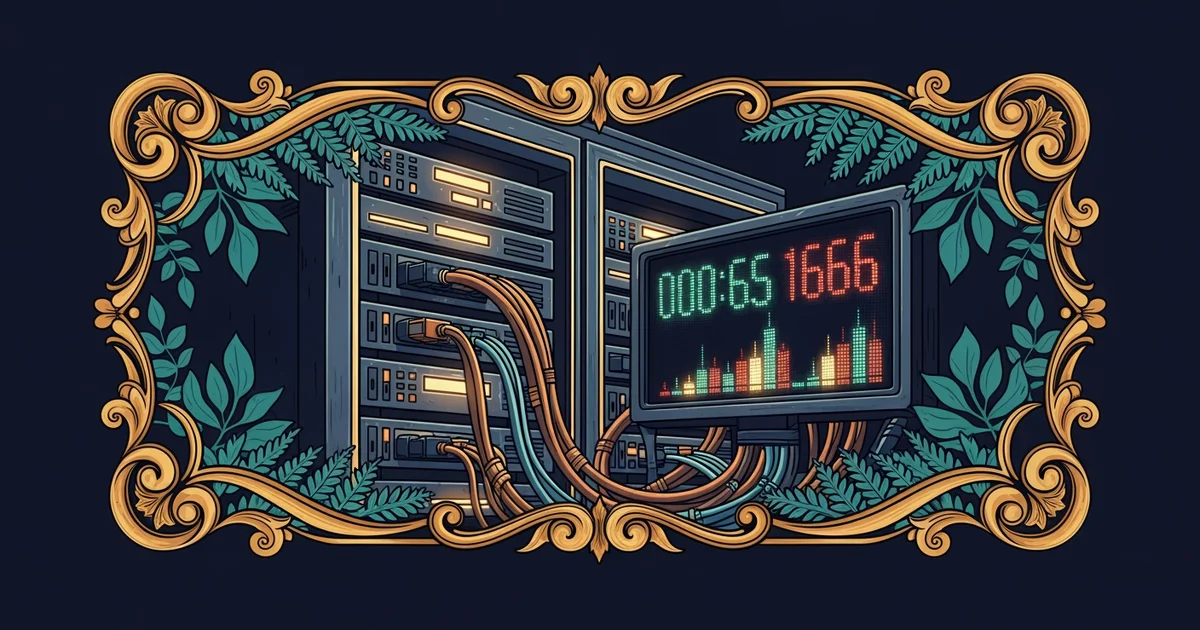
Monitoring System Performance Metrics
To prevent such disasters, engineers use High Frequency Monitoring to track the pulse of their trading infrastructure. This process involves collecting thousands of data points every single second from various network nodes. These metrics include packet loss rates, latency spikes, and server CPU usage levels. Think of this like a pilot watching a complex dashboard during a high-speed flight. If one gauge shows a pressure drop, the pilot must respond before the engine fails completely. In the same way, traders must watch their system metrics to ensure their algorithms behave as expected.
Key term: Latency — the total time delay between the moment a data packet is sent and the moment it is received by the destination server.
Monitoring tools help firms detect performance drift before it impacts the bottom line of the business. Performance drift happens when a system gradually slows down or starts producing slightly inaccurate price quotes over time. This often occurs due to memory leaks or hardware degradation that is not immediately visible to the naked eye. By setting alerts for specific thresholds, teams can intervene before a small technical glitch turns into a massive financial loss. Proactive oversight is the only way to maintain stability in a volatile market environment.
Identifying System Drift Early
Early detection relies on comparing current system behavior against a known baseline of normal operations. If the system deviates from this baseline, the monitoring software triggers an automated alarm for the technical team. This is essentially the same as a car engine light turning on when the oil pressure dips too low. You do not wait for the engine to smoke before you stop the car to check the problem. Financial engineers use a similar logic to protect their capital from unexpected algorithmic behavior in the live market.
Technicians often focus on these three critical performance indicators to maintain system health:
- Network Jitter refers to the variation in packet arrival times, which can cause significant execution delays if it becomes too unstable for the trading software.
- Throughput Capacity measures the total volume of messages the system can process in one second, ensuring the infrastructure does not choke during peak market hours.
- Error Rate Monitoring tracks the frequency of failed connection attempts or rejected orders, helping teams isolate specific hardware components that might be failing under pressure.
Maintaining these metrics requires a well-structured approach to data collection and analysis across the entire network. This is the application of system stability principles from Station 12 working in real conditions. By visualizing these metrics, firms can quickly identify if a problem is localized to one server or if it represents a broader network issue. This visibility allows for rapid decision-making when seconds translate into thousands of dollars of potential risk. Constant vigilance remains the primary defense against the inherent chaos of electronic financial markets.
Effective monitoring transforms raw technical data into actionable insights that prevent small system errors from becoming catastrophic financial losses.
But this model of centralized monitoring faces new challenges as infrastructure scalability demands more distributed network architectures across global data centers. This content is educational only and does not constitute financial or investment advice.